ANLY482 AY2016-17 T2 Group20 Project Overview
Contents
Motivation and Business Problem
Background Information
On average, car dealers spend between $4000 and $20,000 on SaaS products, and spend thousands to find out more about their competitors. The industry itself is highly competitive with franchise dealers (Legacy, Jim Ellis) dominating the market followed by smaller individual dealers.
Business Problem
The resale market makes up about 80% of the total automobile market1. The main problem we are addressing is that resale dealers do not know the best way to price their used cars. Even though other dealers’ pricing information can be found online, it is difficult for retailers to compare prices, mileage, make, customizations along with other factors to come up with the most competitive price. There is also a highly competitive market of resale dealers which shows the seriousness of this problem. We think that by using existing data, modelling and visualizing it can help these resale dealers make better pricing decisions.
Project Objectives
Deliverable
Easy to use web interface that automatically links the daily scraping of data, analyzing the data and coming up with conclusions and result sets that are useful to our sponsors.
Functionality
We model the best suggested price range for the dealer to resell the used cars. These factors include the car model, mileage, make, year, state, city and ZIP input.
Output / Results
- Suggested optimal price range for car resale value
- Improved accuracy of prediction of price based on mileage, depreciation of cars in different states, colour, car model etc.
- Pricing tool with geolocation of competitors
- Visualization of the data in an understandable manner for dealerships to make decisions regarding pricing
Project Details
CompetitorPRO's Architecture

- Data is collected using Ruby workers by crawling and scraping dealers’ websites each day.
- All the collected raw data is stored in AWS RDS in a MySQL database.
- After collection of data, it is cleaned and the output is stored in another table in AWS RDS.
- The main application uses EC2 instances to access data from the AWS RDS MySQL database.
Putty and PowerBI is used to ensure data consistency and raise any failures of the application. AWS S3 is used as a storage backup for all data in the servers and databases.
Data Provided
Data is obtained through crawling of individual dealership websites and other service providers such as autotrader.com and edmunds.com. About 30,000,000 rows, approximately 6GB of data is obtained each day.
The data is saved on MySQL Database and stored on S3 on Amazon Web Services as a .csv file. Below are the description of the 24 factors in the data provided.

Methodology
Data Exploration and Cleaning
Exploratory Data Analysis techniques were used to do a preliminary data sanity check. Using R, statistical description function were utilised to find number of missing values; min; max; range; sum of all non-missing values; median; average; standard error; variance and variance coefficient.
There were quite a few anomalies that need to be further explored.
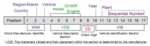
1. Vin
Vin are unique identifiers of each car in the United States. There were at least 20,000 of vin duplicates found. These vin duplicates came from various websites where the same car can be listed on the individual dealer websites and other trading websites such as autotrader.com.
Each of these vin duplicate may have a different price listed with the same Year, Make, Model, Trim listed. However a defining difference is where the timestamp where the data is crawled. From the maximum date, the latest updated data on each vin can be obtained.
2. Year
The min and max of year values found were 1981-2019. The variable “year” which identifies the year that the car was released was beyond 2016 and 2017. The client clarified and ensured that the reason for the data was that some car dealers may choose to not include the year the car was made, or to update the website with future releases of car models.
3. trimName
Current trimNames are not clearly bucketed and there are too many levels in a factor. This poses a difficulty in terms of analysing trimNames as a factor for price.
Histograms were also used to check the frequency of prices of cars and mileage, and backed upon experts who have deep knowledge of the automotive industry.
Histograms were found to be skewed with 80% of values of a certain number for variables of price and mileage.


Others
Upon investigation with the software developers, we found that the delimiter that they have used is in the form of a “,” which may have confused the crawlers as numbers can also contain a comma in the figure. And we suggested to change the “,” to a pipe or tab delimiter.
Lastly, and the most important step, is to ensure that the crawlers are grabbing an accurate dataset, checks on 300 individual vins on each website where the data was grabbed was done manually, ensure that the data we had was accurate.
Through this exercise, we found that there were links which are broken and websites where the data was not grabbed accurately. We informed our client regarding these websites and data was fixed.
We repeated the above steps once again with the same dataset obtained at different dates to do a data sanity check.
Through the exercise, we realised that the programmers do not put in enough interim checks to ensure that daily data is good. And hence we recommended them to put in certain checks such as visualisations. We helped to link PowerBI with their mySQL data using Putty (http://www.putty.org/) where it generates simple illustrations in the forms of graphs. For example, we used unique dealerCount to ensure that they have grabbed all data from all dealers in the United States.
These visualisations are automatically generated each day and early detection of system failure or errors is made possible.
Data Modelling
Factors considered
While the objective of the product is a pricing tool that is able to accurately predict price for a certain car in the market, this project started off as a data science project where we are testing various hypotheses regarding relationship of factors affecting price.
“Nothing is particularly hard if you divide it into small jobs” - Henry Ford, founder of the Ford Motor Company.
In a similar fashion, we chose to prioritise factors that affects pricing most after consulting with industry experts.
There are many factors affecting depreciation of cars, including mileage, year that the car was released, city, make, model. Upon our conversation with David Chisnell and Professor George Easton, we decided to zoom into mileage, make, city and year for our hypothesis testing.
Our hypothesis states that depreciation of cars is significantly different in each year, for different models and cities. We will be implementing regression trees, using k-fold cross-validation to pick the complexity of the tree. Following that, we will be using randomForest modelling that automates the selection of the regression to predict the price range for any random car.
Current Progress
After the data checks are complete, we removed irrelevant data which are out of range from our analysis. An example of irrelevant data would be vins that are tagged for the year 2018 and 2019 which does not make logical sense.
Below shows the histogram of mileage and price of cars for BMW. We consulted our client regarding our initial findings and the CEO feedbacked that it was reflective of the current trends. In testing regression, we tested our assumption of normality of a parametric distribution.

Since the raw data does not fit into any parametric distribution. We explored various transformations include log10, ln, sqrt, cubert. Below shows an example of the histograms after transformation of raw data.

We selected SQRT as the transformation to use for regression as it fits normal distribution the closest.
Results of regressions improved gradually from a simple basic regression of Price ~ Mileage (adjusted R-square of 0.4) to Price~Mileage + ModelName (adjusted R-square of 0.7) and to Price~Mileage + ModelName + Year (adjusted R-square of 0.8).
Below shows a screenshot of regression results. Please find the full example in RegressionBMW.xlsx File:RegressionBMW.xlsx

Observations
Geographical Boundaries
When regression included City as a factor, it became too granular and have resulted in overfitting. Current industry leaders such as Manheim and Cox Automotive have only explored and categorised United States into 6 geographical factors. A possible consideration for regression would be not going into specific cities or state, but to use the Pareto Principle to select the top 20% of cities which accounts for 80% of the cars in United States. Another possible way would be to use the city as a proxy for the states.
Adjusted R^2 as a benchmark for selection of regression trees
Adjusted R^2 can be very high as there is so much natural variation in car data. Hence switching to root-mean-square error (RMSE) for price (in USD dollars) could be a better alternative. In dollar terms, an error of $6,268 on the regression without city factor for the BMW training set.
Too many levels in categorical factor
For the BMW test set, there are 128 unique modelNames. There are very rare model names in the dataset which will influence regression results. After removing about 0.1% of the data for having very rare model names, which cut the sample to 28 models in the other 99.9%. 28 levels is still too high and taking a straight mean by model over production year from train and applying it to test produced an error of $5,666 on the test set.
Hence, for further and future analysis, we may consider reducing number of levels for various makes. A possible way would be using the common models and re-categorising rare models as “Other”. However this poses a conflict of interest with our client as the aim of the tool is to produce a price suggestion for each vin in the United States.
Defining geographical boundaries
Current geographical boundaries are divided by states and its counties. However there are 50 states and 3114 counties which results in too many categorical variables. There are 3 possible methods to defining geographical boundaries. Firstly, we could use the current industry geographical segmentation such as Nielsen DMAs or Manheim’s regional markets.
Since the pricing tool is a competitive tool helping dealers to get a competitive edge against another dealer. Hence, another possible way of defining geographical boundaries is to use a customised version such as drawing a radius of 100 miles by ZIP centroid. While this approach is easy to understand and avoids concerns from dealerships who sit on boundaries of county or state lines, it is computationally intensive as we run a separate query and regression for every dealer in the United States.
Lastly, we could continue with geographical boundaries based on state and county lines or create our own geographical segmentation.
Application Visualization
Technology
| Technology | Function |
|---|---|
| HTML | HTML5 for the front end of web application |
| CSS | CSS3 for the front end of web application |
| JavaScript | Javascript for front end of web application
D3 library for visualization if needed jQuery to simplify Javascript functions and ensure cross-browser functionality |
| MySQL | Query database used for CompetitorPro application |
| AWS EC2 | Cloud computing power for scalability. To repeat tests and run automated codes. |
| Python | Scikit for random forest - http://scikit-learn.org/stable/index.html |
| Ruby | Ruby on Rails for backend of web application |
| R | Statistical Analysis of Data, randomForest modelling, regression trees
Shiny R - To build web applications based using R. |
Risks & Limitations
| Risks & Limitations | Mitigation Strategy |
|---|---|
| Data received unusable for analysis |
Clear and effective communication with client to manage expectations and ensure that data required is given |
| Lack of experience with analytical modelling (eg. randomForest) |
Explore and familiarise with the analytical modelling prior to using them to perform actual analyses. Read previous projects done by community and consult advisors. |
| Changes in work schedule due to unexpected events, delays and time zone difference |
Communicate with client and set regular meeting timings. Team members to stay up to date on deliverables and project timeline.
|
References
Unique identifiers of car, VIN :
- National Highway Traffic Safety Administration: https://vpic.nhtsa.dot.gov/decoder/
- What is in a VIN? https://vpic.nhtsa.dot.gov/
Research on randomForest modeling: