ANLY482 AY1516 G1 Team Skulptors - Project Management
![]()
| Project Schedulenew! | Work Plan new! | Change Management new! | Risk Management | Team Reflectionnew! |
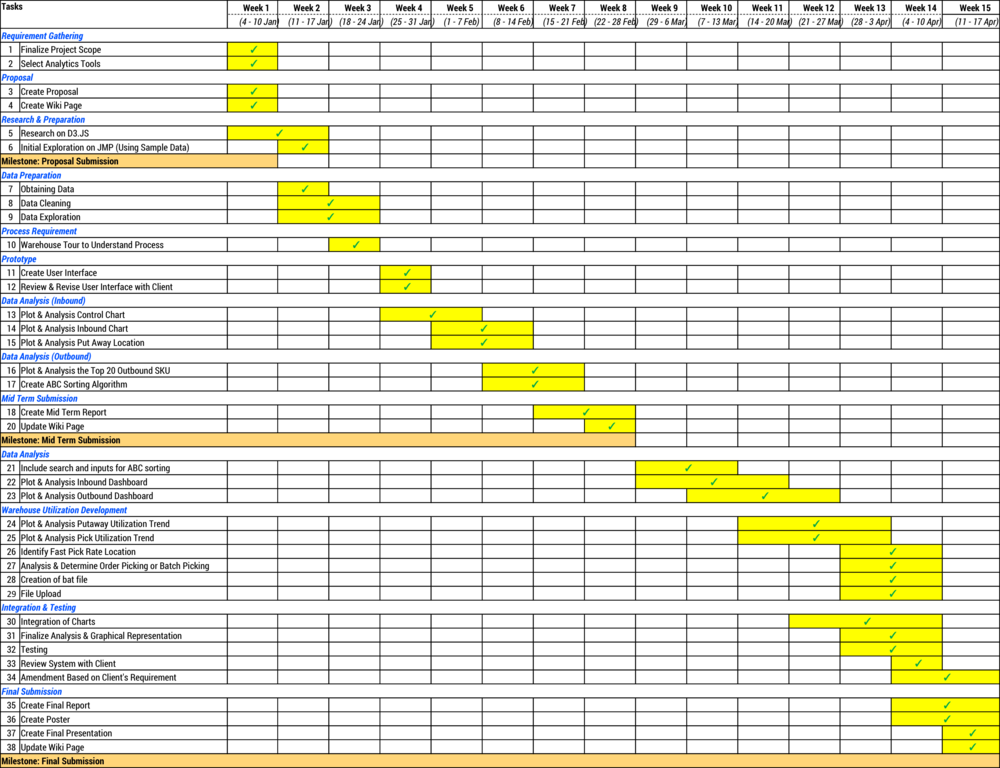
Phase 1: Week 1-2
This phase was targeted at preparation for the proposal submission, which involved heavily on requirement gathering. On top of requirement gathering preparation for the proposal, we evaluated the tools available to us, trying them out to see whether they fit the bill for our deliverables. We spend the first two week of the semester preparing and evaluating these.
Phase 2: Week 3-8
Upon approval of our proposal, our team engages in phase 2, which builds the foundation of our project. In the first few weeks of this phase, much of the time is pushed towards understanding the data better, as well as a visit to our sponsor’s warehouse to better understand the problems faced. This experience was a great first hand exposure to us as the three of us have never seen the warehouses before.
In Week 4, we started developing mockups to let our sponsors and users have a feel of what we are planning to develop for them. The prototypes went through revisions as well in order to cater a customized and effective solution for our client. These mockups were done on a Tableau to give our client a look and feel to our envisioned product.
From Week 5 onwards, we started to get our hands dirty, developing our prototype through the use of the library, D3.js, We consistently seek feedback from both our sponsor and our professor, Prof. Kam, as we felt that our experience in visual analytics were effectively none. Our inbound and outbound layouts are still in the midst of change, having in mind an interactive dashboard for the finals.
The last week of this phase was spent mainly in developing this report, managing expectations of our client and consolidating our work progress with one another.
Phase 3: Week 9-15 (Current Phase)
The final phase of the project would focus mainly on warehouse utilization. Our client hopes to have a visual display of how much and which part of their warehouse are stocked/filled. Using our dashboard, our client should be able to identify where they should locate their fast moving goods, where to store them in the future etc.
On top of this function, we will be further improvising on the inbound and outbound charts, to create the interactive map as suggested by Prof Kam. Charts will be dynamically displayed on clicking on the time period.
The main crux of the later end of this phase will revolve strongly on integration and testing. This step requires commitment of team members to constantly meet up and do the finishing touches for our application. Testing will be done mainly by our client to test and sieve out potential problems.