Difference between revisions of "AY1516 T2 Team HealthTics Analysis final"
Sanyein.2012 (talk | contribs) (Created page with "<!--Header Start--> {|style="background-color:#ffffff; color:#ffff; padding: 5 0 5 0;" width="100%" cellspacing="0" cellpadding="0" valign="top" border-left= "1" solid #ffffff...") |
Sanyein.2012 (talk | contribs) |
||
| Line 25: | Line 25: | ||
|} | |} | ||
| + | |||
| + | ==<div style="background: #3498db; padding: 13px; text-align:center; line-height: 0.3em; font-size:15px; font-family:Helvetica"><font color= #F5F5F5>LITERATURE REVIEW</font></div>== | ||
| + | |||
| + | In the article “A Web-based browsing and spatial analysis system for regional natural resource analysis and mapping” 7, the authors have discussed that traditional GIS techniques and tools are lack of efficiency and ease of use in delivery mechanism. For example, installation or hosting of GIS application and knowledge about geographic and GIS are required to use and understand the GIS analysis. Due to these constraints, many professionals outside GIS community have difficulties in applying GIS techniques in their practical uses. As such, more flexible and feasible web-based GIS applications are introduced.<br/> | ||
| + | |||
| + | The authors also explained about earlier versions of server-centric web GIS applications, which consist of 2-tiers: client and server. In these server-centric applications, both data-access and geospatial analysis tasks are carried out in server. The client-tier is the browser and is only used to get access to the server without prior installation in one’s computer. As a result, it overburdens the server over time. Since server cannot handle increasing volume of users and data, such server-centric GIS applications becomes impractical.<br/> | ||
| + | |||
| + | Because of performance issues as well as more flexible and advanced programming languages, client-side web GIS are now widely used by professionals in many fields. The flexible programming languages help create a customized environment for the end users so that knowledge about GIS techniques is no longer required in practical applications.<br/> | ||
| + | |||
| + | Moreover, the article gave an example of load-balanced web GIS application, WebSAS. WebSAS follows 3-tier architecture: client, application server and database. The architecture spreads out the work load in each tier and the database system provides image files so that the end user do not need understanding about geographic elements. Figure 1. shows the basic architecture of WebSAS’s 3-tiers. The downside of such 3-tiered application is that the cost of setting up each tier is expensive and it requires regular maintenance on application server tier and database tier. Due to high cost of implementation, not many organization could implement web GIS in practical use.<br/> | ||
| + | |||
| + | The key factors of web-based GIS application are efficiency and ease of use. Developers should focus on load balancing for efficient data retrieval/access, apply proper GIS techniques, and understand end-user’s requirement from the application.<br/> | ||
| + | [[File:Healthtics websas architecture.png|framed|center|Figure 1 - Basis Architecture of WebSAS]] | ||
| + | |||
| + | |||
| + | ==<div style="background: #3498db; padding: 13px; text-align:center; line-height: 0.3em; font-size:15px; font-family:Helvetica"><font color= #F5F5F5>Review of Similar Work </font></div>== | ||
| + | |||
| + | OneMap is an integrated map system for government agencies to share and deliver location-based services and information among many government agencies. This web-based application is open to public as well as any other organization such as business entities to perform their own geospatial-related analysis. It contains a comprehensive list of map layers such as population density, property market information, etc and their respective metadata.<br/> | ||
| + | |||
| + | In addition, OneMap provides aggregated services to display geospatial data on external government websites, such as BizMap, BirdWatching Hotspots, Water Level Sensors. Those websites make use of the base map and some functionalities provided by OneMap as well as secondary sources which are inherited from OneMap. Similar to this functionality, our project could also provide a list of API’s for sharing of base map layer and other basic geospatial functionalities to other HPB websites that require similar services.<br/> | ||
| + | |||
| + | By using OneMap, users are able to plot out geospatial data from readily-available services, such as SchoolQuery, LandQuery and PopulationQuery. The concept of this functionality could be applied to our project as well, which is to prepare various datasets that are commonly used by the end-users. <br/> | ||
| + | |||
| + | Additionally, users are able to import external KML data to be overlaid on the base map layer together with existing geospatial layer in OneMap. As shown by figure 2 above, layer from RelaxSG.kml denoted by the blue pins and PopulationQuery represented by different colours on the map are overlaid together in OneMap. As such, users are able to analyse the number of parks from RelaxSG.kml together with the population in various planning areas from PopulationQuery. Again, such a functionality could be implemented in our project because it is catered to additional geospatial layers that will be added at an ad-hoc basis by HPB users.<br/> | ||
| + | |||
| + | Given the similar functionalities in both our project and those in OneMap, we have observed some limitations in OneMap that should be improved in our project. Some of those limitations are listed below: <br/> | ||
| + | |||
| + | * External KML datasets cannot exceed 2MB. Such limitation hinders the overlaying of large datasets. | ||
| + | * Only one KML layer can be imported at a time to overlay on the map as such comparison of different layers cannot be done effectively. | ||
| + | |||
| + | All in all, OneMap is a good starting point for us to have an understanding of a web GIS system. However, it does not have sophisticated analysis functionalities that are required in our projects. As such, we need to do more thorough researches into technical implementations from open-source geospatial libraries, such as TurfJS and GDAL, and modify them to suit our project’s needs. | ||
| + | |||
| + | [[File:Onemap.jpeg|800px|framed|center|Figure 2 - OneMap]] | ||
| + | |||
| + | ==<div style="background: #3498db; padding: 13px; text-align:center; line-height: 0.3em; font-size:15px; font-family:Helvetica"><font color= #F5F5F5>DATA</font></div>== | ||
| + | |||
| + | This application uses 3 main data sources to plan out the facility utilization in Singapore. The data sources are 1) base map, 2) HDB map layer and 3) facility map layers. | ||
| + | |||
| + | ===BASEMAP=== | ||
| + | |||
| + | OpenStreetMap is used as base map layer in this project. OpenStreetMap is an open collaborative project to create a free editable map of the world. It is made available as a base map for many other projects. Moreover, this service is one of the base maps used in ArcGIS map viewer. | ||
| + | |||
| + | ===HDB MAP LAYER=== | ||
| + | |||
| + | The HDB map layer contains postal codes of all HDBs in Singapore. The postal codes are later converted to SVY21 format to plot on base map layer and perform required calculations. | ||
| + | |||
| + | ===FACILITY MAP LAYER=== | ||
| + | |||
| + | Facility map layers contains different map layers of heath promotion options such as park location, smoking cessation touchpoints, healthier dining outlets, etc. These datasets are available to public on data.gov.sg:https://data.gov.sg/dataset?organization=health-promotion-board . The layers can be in non-geospatial files such as csv of HDB with postal codes or geospatial files such as shapefile, and kml files. These data files include information on name of facility, description, location points: coordinate points in spatial file and postal code in non-spatial file, and other related attributes. | ||
| + | |||
| + | ==<div style="background: #3498db; padding: 13px; text-align:center; line-height: 0.3em; font-size:15px; font-family:Helvetica"><font color= #F5F5F5>WEB GIS APPLICATION FOR FACILITY PLANNING </font></div>== | ||
| + | |||
| + | The efficiency of web GIS application largely depends on load balancing framework. To reduce overburdening the server and cost of investment in infrastructure for large servers, our group decides to use client centric web GIS with 2 tiers: Client and Application. | ||
| + | |||
| + | Application tier uses light-weight open source javascript libraries and GIS services to process data and do calculations. Meanwhile, client tier provides functions for user interaction such as file upload, criteria selection and report visualization. | ||
| + | |||
| + | By splitting workload between 2 tiers, this web GIS application avoids overloading only in one tier and works smoothly. | ||
| + | |||
| + | The application is structured in Express framework which is a light-weight web application framework to easily organize the web application into an MVC architecture on the server side. Along with Express framework, node.js and turf.js are integrated together to perform server-side processing. Node.js is a runtime system allowing to exchange data freely using real-time two-way connections, where both the client and server can initiate communication. To do geoprocessing on web application, this application uses Turf.js which is a open source javascript library. Turf.js offers useful geoprocessing functions which enables fast and effective data-processing. | ||
| + | |||
| + | Only open-source javascript libraries are used for both front-end and back-end processing since javascript unifies the language and data format (JSON) as well as enables light-weight performance and effective integration with visualization. A number of web services such as ORGE and SLA are also used in this application to consume spatial functionalities provided by trusted organization and open-source communities. For example, OSM web-service is used to get OpenStreetMap layer. | ||
| + | |||
| + | The application consists of 3 main steps: 1) file uploading and data preparation, 2) KPI calculation and reporting, and 3) Visualization. | ||
| + | |||
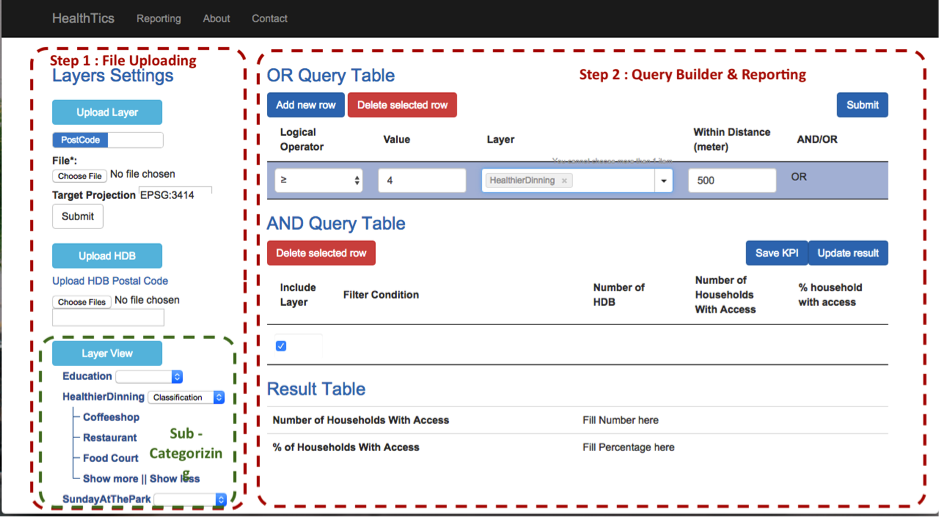
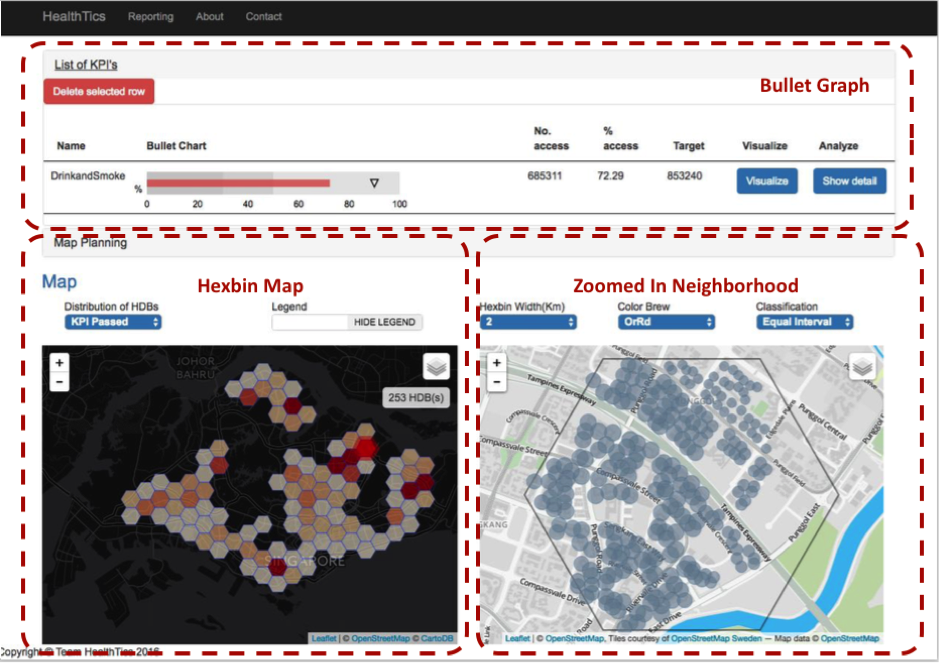
| + | The functions are implemented in 2 web pages as shown in Figure 5.1 and Figure 5.2. File uploading and data processing, and KPI calculation and reporting are implemented in page 1 (Figure 3). The final step, visualization, in page 2 (Figure 4) utilizes the results generated from step 2 of page 1. | ||
| + | |||
| + | [[File:page 1.png|800px|framed|center|Figure 3 - Page 1]] | ||
| + | |||
| + | [[File:page 2.png|800px|framed|center|Figure 4 - Page 2]] | ||
| + | |||
| + | ===FILE UPLOADING AND DATA PREPARATION=== | ||
| + | |||
| + | File uploading functions enables the users to upload their own layer files to perform analysis. As shown in Figure 5.1, users can upload HDB layer and other health promotion facility layers. The data of HDB layers can be in postal code and that of health promotion facility layers can be in either postal code or XY coordinates. All the data with postal code will be geocoded using web service provided by OneMap Singapore before continuing with projection and conversion to geojson. | ||
| + | |||
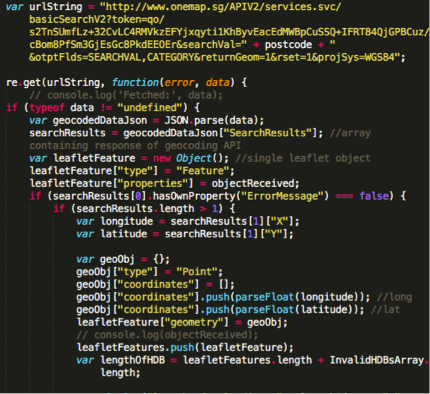
| + | In geocoding process, public web service provided by OneMap Singapore is called and get the attributes of each location point. The function is implemented as followed: | ||
| + | |||
| + | [[File:Healthtics code 1.png|center]] | ||
| + | |||
| + | In this project, EPSG Projection 3414-SVY21 will be used to perform all spatial functionalities. As such, we can accurately measure distances between location points in kilometres and calculate correct KPI for each buffer in next steps. | ||
| + | |||
| + | Proj4js library used to transform different types of coordinates to 3414-SVY21 coordinate system. Proj4js is an open source javascript library to transform point coordinates from one coordinate system to another. | ||
| + | |||
| + | To use this library, we define Singapore projection as follwed and apply to each of the coordinates of user-uploaded data. | ||
| + | |||
| + | [[File:Healthtics code 2.png|center]] | ||
| + | |||
| + | Once the projection is done, the data will be translated into geojson files for its nature of compatibility, lightweight and flexibility. In addition, geojson file has ability to integrate easily with leafletjs and turfjs to generate map-vectors. | ||
| + | |||
| + | To translate the files into geojson format, OGRE web client tool is used. OGRE is a popular ogr2ogr web client(service) to translate various types of spatial data to Geojson format. (The API used: http://ogre.adc4gis.com/convert) This web client is an open source and used in many applications. | ||
| + | |||
| + | For all the uploaded health promotion facility layers, users can choose column to sub-categorize within the dataset. | ||
| + | |||
| + | ===KPI CALCULATION AND REPORTING=== | ||
| + | |||
| + | In step 2, users can create queries using query builder in OR and AND conditions. Each selection consists of the health promotion facility/option (or its sub-category), quantity of the facility/option, and buffer distance to calculate KPI. There are two steps in query building: OR query and AND query. | ||
| + | |||
| + | The ‘OR Query Builder’ allows user to choose details of each layer and one or more criteria can be joined with ‘OR’ condition. For each criteria, user has to choose the layer name, operator, number of layer points and radial distance in meters. The selected criteria will be operated in ‘OR’ condition and user has to submit for each combination of ‘OR’ criteria. | ||
| + | |||
| + | For each criteria/set of criteria submitted in ‘OR Query builder’, a new row will be added to ‘AND Query builder’. As such, AND query builder will have a set of ‘OR’ queries and assess them by AND logic. In addition, detailed results will be performed for each OR query and user can toggle to include or exclude the query in final result. | ||
| + | |||
| + | The KPI we will be calculating in this project is the percent of residents with access to health promotion options within x km. The final KPI will be calculated using the following formula: | ||
| + | |||
| + | [[File:Healthtics_formula.png|center]] | ||
| + | |||
| + | KPI calculation is based on the query from ‘OR’ and ‘AND’ query builders and pre-processed data. Once a user has selected a query, the application uses method of turfjs to create a buffer and filter out the HDBs whose coordinates fall inside the buffer. Turfjs creates a buffer from each point of selected layer and filters out the HDBs which fall inside the buffer. | ||
| + | |||
| + | Turfjs is a powerful tool to do geoprocessing on web application. It helps to buffer a location point and then checks whether the desired layers fall within the buffer. Moreover, turfjs offers a lot of useful functionalities and we have used some of them in this project. For example, filter function is used to extract a particular group of data in geojson file. Turfjs API can be found at: http://turfjs.org/static/docs/ | ||
| + | For the first step of the query, which is ‘OR’ logic, each HDB id checked if it satisfies any one of the criteria. In second step, ‘AND’ logic checks if all the ‘OR’ logic are satisfied and counts the HDB if it fulfils. After that, total dwelling unit of the filtered HDBs is calculated by summing up the dwelling units of every HDB from the filtered list. Finally KPI is calculated. | ||
| + | |||
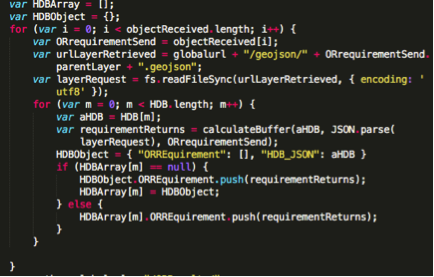
| + | KPI is calculated using 2 types of queries: OR and AND query. Firstly, OR query is executed as shown below: | ||
| + | |||
| + | [[File:Healthtics code 3.png|center]] | ||
| + | |||
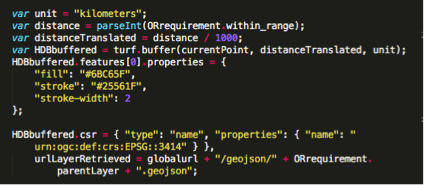
| + | In OR query, buffers are created from each HDB by calling calculateBuffer method which uses turf.js. The calculateBuffer method uses turf.js to create buffer for HDBs as shown below. | ||
| + | |||
| + | [[File:Healthtics code 4.png|center]] | ||
| + | |||
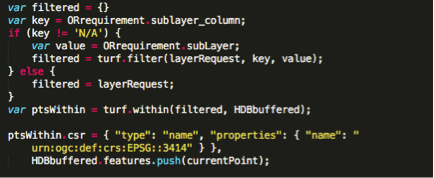
| + | After that, calculateBuffer method checks if the points in each layer file fall within the HDB buffers. | ||
| + | |||
| + | [[File:Healthtics code 5.png|center]] | ||
| + | |||
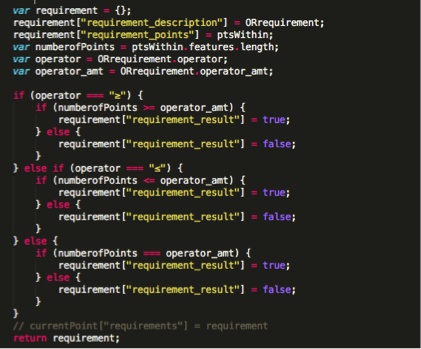
| + | Finally, calculateBuffer method checks if the HDBs satisfy the quantity and operator specified by user. A a filtered list is returned to the OR query execution and calculateBuffer method ends. | ||
| + | |||
| + | [[File:Healthtics code 6.png|center]] | ||
| + | |||
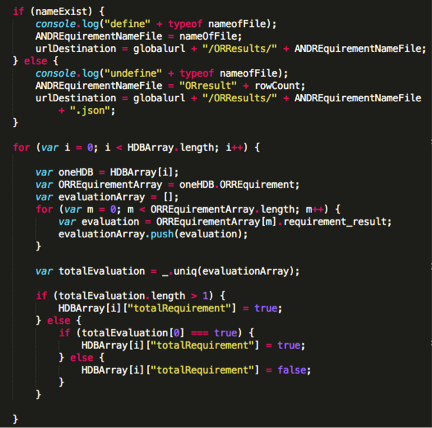
| + | If it is AND query, the results from OR queries are combined and filtered out the HDBs that fulfil the AND condition. | ||
| + | |||
| + | [[File:Healthtics code 6.png|center]] | ||
| + | |||
| + | HDB results are then written into a geojson file so that client tier can access and use in calculating final result and visualizing on dashboard. | ||
| + | |||
| + | [[File:Healthtics code 7.png|center]] | ||
| + | |||
| + | The KPI results of each OR query as well as consolidated final KPI of one or more AND queries are then sent back to client tier to include in report. The sub-KPIs, which are the KPIs for OR queries, allows users to understand the breakdown and outliers, if any. Final calculations will be made using AND query and number of households with access and percent of households with access are showed to the user as final KPI reporting. For example, user can measure how many households have access to a healthy dining restaurant within 500 m. This allows HPB, Ministry of Health Singapore and Singapore government to measure and understand current status of each facility provided. | ||
| + | |||
| + | ==<div style="background: #3498db; padding: 13px; text-align:center; line-height: 0.3em; font-size:15px; font-family:Helvetica"><font color= #F5F5F5>Review of Similar Work </font></div>== | ||
Revision as of 15:40, 16 April 2016
| MIDTERM PROGRESS | FINAL PROGRESS |
Contents
LITERATURE REVIEW
In the article “A Web-based browsing and spatial analysis system for regional natural resource analysis and mapping” 7, the authors have discussed that traditional GIS techniques and tools are lack of efficiency and ease of use in delivery mechanism. For example, installation or hosting of GIS application and knowledge about geographic and GIS are required to use and understand the GIS analysis. Due to these constraints, many professionals outside GIS community have difficulties in applying GIS techniques in their practical uses. As such, more flexible and feasible web-based GIS applications are introduced.
The authors also explained about earlier versions of server-centric web GIS applications, which consist of 2-tiers: client and server. In these server-centric applications, both data-access and geospatial analysis tasks are carried out in server. The client-tier is the browser and is only used to get access to the server without prior installation in one’s computer. As a result, it overburdens the server over time. Since server cannot handle increasing volume of users and data, such server-centric GIS applications becomes impractical.
Because of performance issues as well as more flexible and advanced programming languages, client-side web GIS are now widely used by professionals in many fields. The flexible programming languages help create a customized environment for the end users so that knowledge about GIS techniques is no longer required in practical applications.
Moreover, the article gave an example of load-balanced web GIS application, WebSAS. WebSAS follows 3-tier architecture: client, application server and database. The architecture spreads out the work load in each tier and the database system provides image files so that the end user do not need understanding about geographic elements. Figure 1. shows the basic architecture of WebSAS’s 3-tiers. The downside of such 3-tiered application is that the cost of setting up each tier is expensive and it requires regular maintenance on application server tier and database tier. Due to high cost of implementation, not many organization could implement web GIS in practical use.
The key factors of web-based GIS application are efficiency and ease of use. Developers should focus on load balancing for efficient data retrieval/access, apply proper GIS techniques, and understand end-user’s requirement from the application.
Review of Similar Work
OneMap is an integrated map system for government agencies to share and deliver location-based services and information among many government agencies. This web-based application is open to public as well as any other organization such as business entities to perform their own geospatial-related analysis. It contains a comprehensive list of map layers such as population density, property market information, etc and their respective metadata.
In addition, OneMap provides aggregated services to display geospatial data on external government websites, such as BizMap, BirdWatching Hotspots, Water Level Sensors. Those websites make use of the base map and some functionalities provided by OneMap as well as secondary sources which are inherited from OneMap. Similar to this functionality, our project could also provide a list of API’s for sharing of base map layer and other basic geospatial functionalities to other HPB websites that require similar services.
By using OneMap, users are able to plot out geospatial data from readily-available services, such as SchoolQuery, LandQuery and PopulationQuery. The concept of this functionality could be applied to our project as well, which is to prepare various datasets that are commonly used by the end-users.
Additionally, users are able to import external KML data to be overlaid on the base map layer together with existing geospatial layer in OneMap. As shown by figure 2 above, layer from RelaxSG.kml denoted by the blue pins and PopulationQuery represented by different colours on the map are overlaid together in OneMap. As such, users are able to analyse the number of parks from RelaxSG.kml together with the population in various planning areas from PopulationQuery. Again, such a functionality could be implemented in our project because it is catered to additional geospatial layers that will be added at an ad-hoc basis by HPB users.
Given the similar functionalities in both our project and those in OneMap, we have observed some limitations in OneMap that should be improved in our project. Some of those limitations are listed below:
- External KML datasets cannot exceed 2MB. Such limitation hinders the overlaying of large datasets.
- Only one KML layer can be imported at a time to overlay on the map as such comparison of different layers cannot be done effectively.
All in all, OneMap is a good starting point for us to have an understanding of a web GIS system. However, it does not have sophisticated analysis functionalities that are required in our projects. As such, we need to do more thorough researches into technical implementations from open-source geospatial libraries, such as TurfJS and GDAL, and modify them to suit our project’s needs.
DATA
This application uses 3 main data sources to plan out the facility utilization in Singapore. The data sources are 1) base map, 2) HDB map layer and 3) facility map layers.
BASEMAP
OpenStreetMap is used as base map layer in this project. OpenStreetMap is an open collaborative project to create a free editable map of the world. It is made available as a base map for many other projects. Moreover, this service is one of the base maps used in ArcGIS map viewer.
HDB MAP LAYER
The HDB map layer contains postal codes of all HDBs in Singapore. The postal codes are later converted to SVY21 format to plot on base map layer and perform required calculations.
FACILITY MAP LAYER
Facility map layers contains different map layers of heath promotion options such as park location, smoking cessation touchpoints, healthier dining outlets, etc. These datasets are available to public on data.gov.sg:https://data.gov.sg/dataset?organization=health-promotion-board . The layers can be in non-geospatial files such as csv of HDB with postal codes or geospatial files such as shapefile, and kml files. These data files include information on name of facility, description, location points: coordinate points in spatial file and postal code in non-spatial file, and other related attributes.
WEB GIS APPLICATION FOR FACILITY PLANNING
The efficiency of web GIS application largely depends on load balancing framework. To reduce overburdening the server and cost of investment in infrastructure for large servers, our group decides to use client centric web GIS with 2 tiers: Client and Application.
Application tier uses light-weight open source javascript libraries and GIS services to process data and do calculations. Meanwhile, client tier provides functions for user interaction such as file upload, criteria selection and report visualization.
By splitting workload between 2 tiers, this web GIS application avoids overloading only in one tier and works smoothly.
The application is structured in Express framework which is a light-weight web application framework to easily organize the web application into an MVC architecture on the server side. Along with Express framework, node.js and turf.js are integrated together to perform server-side processing. Node.js is a runtime system allowing to exchange data freely using real-time two-way connections, where both the client and server can initiate communication. To do geoprocessing on web application, this application uses Turf.js which is a open source javascript library. Turf.js offers useful geoprocessing functions which enables fast and effective data-processing.
Only open-source javascript libraries are used for both front-end and back-end processing since javascript unifies the language and data format (JSON) as well as enables light-weight performance and effective integration with visualization. A number of web services such as ORGE and SLA are also used in this application to consume spatial functionalities provided by trusted organization and open-source communities. For example, OSM web-service is used to get OpenStreetMap layer.
The application consists of 3 main steps: 1) file uploading and data preparation, 2) KPI calculation and reporting, and 3) Visualization.
The functions are implemented in 2 web pages as shown in Figure 5.1 and Figure 5.2. File uploading and data processing, and KPI calculation and reporting are implemented in page 1 (Figure 3). The final step, visualization, in page 2 (Figure 4) utilizes the results generated from step 2 of page 1.
FILE UPLOADING AND DATA PREPARATION
File uploading functions enables the users to upload their own layer files to perform analysis. As shown in Figure 5.1, users can upload HDB layer and other health promotion facility layers. The data of HDB layers can be in postal code and that of health promotion facility layers can be in either postal code or XY coordinates. All the data with postal code will be geocoded using web service provided by OneMap Singapore before continuing with projection and conversion to geojson.
In geocoding process, public web service provided by OneMap Singapore is called and get the attributes of each location point. The function is implemented as followed:
In this project, EPSG Projection 3414-SVY21 will be used to perform all spatial functionalities. As such, we can accurately measure distances between location points in kilometres and calculate correct KPI for each buffer in next steps.
Proj4js library used to transform different types of coordinates to 3414-SVY21 coordinate system. Proj4js is an open source javascript library to transform point coordinates from one coordinate system to another.
To use this library, we define Singapore projection as follwed and apply to each of the coordinates of user-uploaded data.
Once the projection is done, the data will be translated into geojson files for its nature of compatibility, lightweight and flexibility. In addition, geojson file has ability to integrate easily with leafletjs and turfjs to generate map-vectors.
To translate the files into geojson format, OGRE web client tool is used. OGRE is a popular ogr2ogr web client(service) to translate various types of spatial data to Geojson format. (The API used: http://ogre.adc4gis.com/convert) This web client is an open source and used in many applications.
For all the uploaded health promotion facility layers, users can choose column to sub-categorize within the dataset.
KPI CALCULATION AND REPORTING
In step 2, users can create queries using query builder in OR and AND conditions. Each selection consists of the health promotion facility/option (or its sub-category), quantity of the facility/option, and buffer distance to calculate KPI. There are two steps in query building: OR query and AND query.
The ‘OR Query Builder’ allows user to choose details of each layer and one or more criteria can be joined with ‘OR’ condition. For each criteria, user has to choose the layer name, operator, number of layer points and radial distance in meters. The selected criteria will be operated in ‘OR’ condition and user has to submit for each combination of ‘OR’ criteria.
For each criteria/set of criteria submitted in ‘OR Query builder’, a new row will be added to ‘AND Query builder’. As such, AND query builder will have a set of ‘OR’ queries and assess them by AND logic. In addition, detailed results will be performed for each OR query and user can toggle to include or exclude the query in final result.
The KPI we will be calculating in this project is the percent of residents with access to health promotion options within x km. The final KPI will be calculated using the following formula:
KPI calculation is based on the query from ‘OR’ and ‘AND’ query builders and pre-processed data. Once a user has selected a query, the application uses method of turfjs to create a buffer and filter out the HDBs whose coordinates fall inside the buffer. Turfjs creates a buffer from each point of selected layer and filters out the HDBs which fall inside the buffer.
Turfjs is a powerful tool to do geoprocessing on web application. It helps to buffer a location point and then checks whether the desired layers fall within the buffer. Moreover, turfjs offers a lot of useful functionalities and we have used some of them in this project. For example, filter function is used to extract a particular group of data in geojson file. Turfjs API can be found at: http://turfjs.org/static/docs/ For the first step of the query, which is ‘OR’ logic, each HDB id checked if it satisfies any one of the criteria. In second step, ‘AND’ logic checks if all the ‘OR’ logic are satisfied and counts the HDB if it fulfils. After that, total dwelling unit of the filtered HDBs is calculated by summing up the dwelling units of every HDB from the filtered list. Finally KPI is calculated.
KPI is calculated using 2 types of queries: OR and AND query. Firstly, OR query is executed as shown below:
In OR query, buffers are created from each HDB by calling calculateBuffer method which uses turf.js. The calculateBuffer method uses turf.js to create buffer for HDBs as shown below.
After that, calculateBuffer method checks if the points in each layer file fall within the HDB buffers.
Finally, calculateBuffer method checks if the HDBs satisfy the quantity and operator specified by user. A a filtered list is returned to the OR query execution and calculateBuffer method ends.
If it is AND query, the results from OR queries are combined and filtered out the HDBs that fulfil the AND condition.
HDB results are then written into a geojson file so that client tier can access and use in calculating final result and visualizing on dashboard.
The KPI results of each OR query as well as consolidated final KPI of one or more AND queries are then sent back to client tier to include in report. The sub-KPIs, which are the KPIs for OR queries, allows users to understand the breakdown and outliers, if any. Final calculations will be made using AND query and number of households with access and percent of households with access are showed to the user as final KPI reporting. For example, user can measure how many households have access to a healthy dining restaurant within 500 m. This allows HPB, Ministry of Health Singapore and Singapore government to measure and understand current status of each facility provided.


