MEETING MINUTES
SUPERVISOR MEETINGS
DELIVERABLES
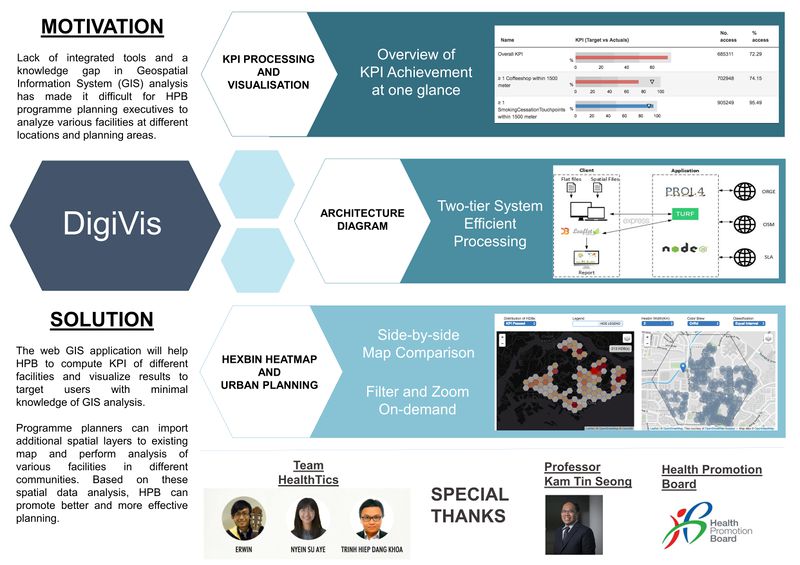
PROJECT POSTER
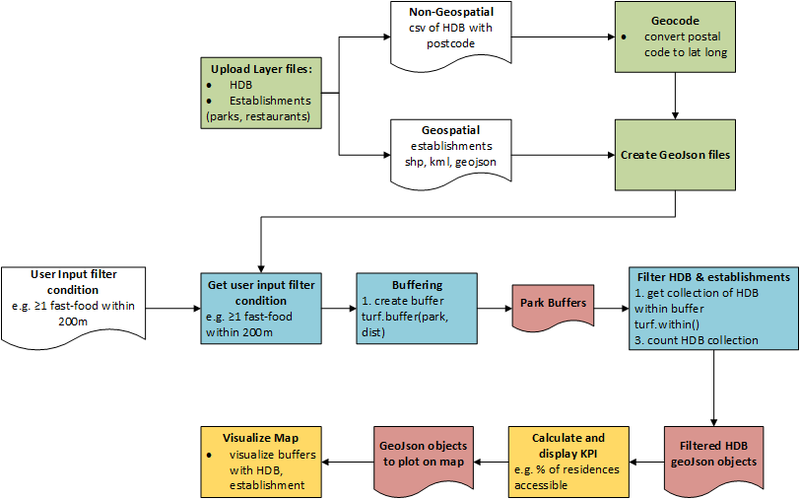
DATA FLOW CHART
USER INTERFACE MOCKUPS
MOCKUP #1
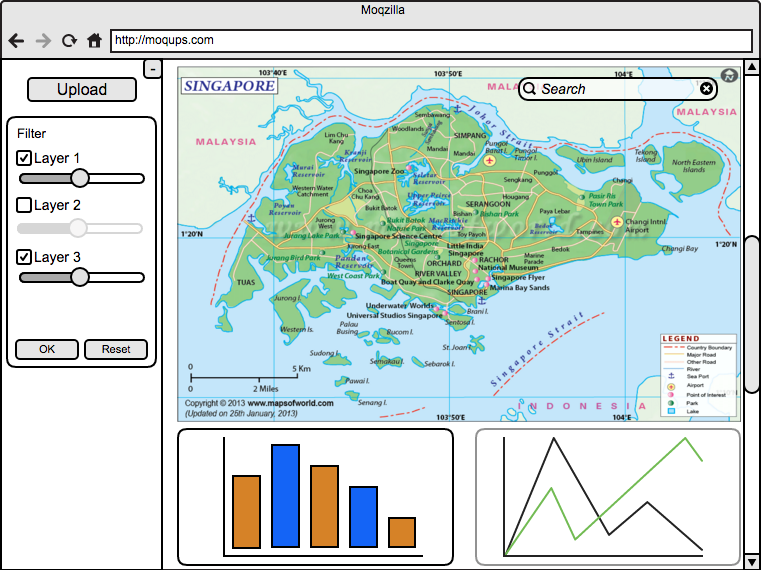
As shown above, the initial storyboard was designed to cater to the file upload and mapping function that were mentioned during a meeting with the sponsor. On the left hand side of the user interface, there are filters to select how many points to be shown on the map. The bottom of the page is reserved for displaying charts that are related to the analysis performed on the map. However, as there are more discussions with our project supervisor and project sponsor, this version of storyboard is not able to meet the client’s requirement. As such, our team designed the next version of the storyboard.
MOCKUP #2
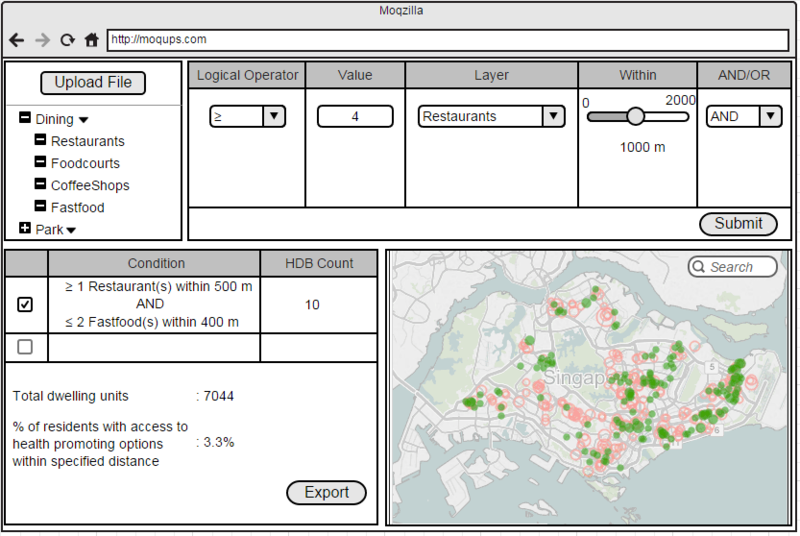
After receiving feedbacks from both Prof Kam and our sponsor, we have revised on our mockup to improve functionality and feasibility. In this new mockup, HPB programme planners can upload files (both spatial and non-spatial) to add layers. Parent/child trees would satisfy the business requirement of categories and sub-categories. For example, fast-food chain is a sub-category of main category dining Planners can define criteria and choose "AND" "OR" situation of selected criteria. Toggle feature is added for better and less crowded visualization on the map so that planners can pick certain criteria to highlight on the map.


