Difference between revisions of "Visualization of Consumer Satisfaction"
Jump to navigation
Jump to search
| Line 31: | Line 31: | ||
! Chart Type !! Demo Version !!Version 1 !! Version 2 !! Version 3 !! Version 4 !! Version 5 !! Version 6 | ! Chart Type !! Demo Version !!Version 1 !! Version 2 !! Version 3 !! Version 4 !! Version 5 !! Version 6 | ||
|- | |- | ||
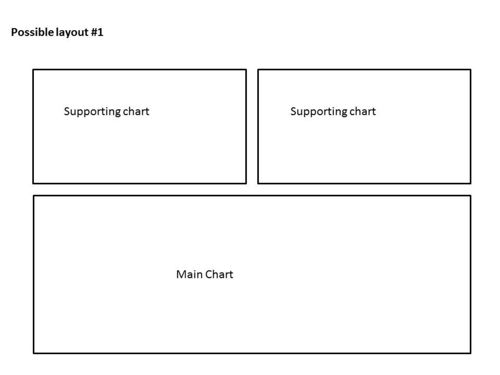
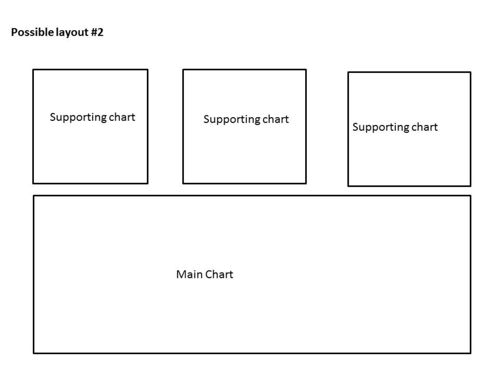
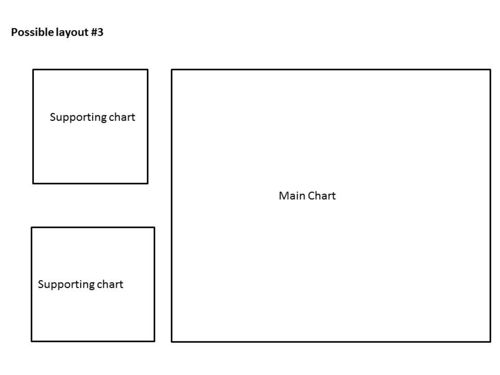
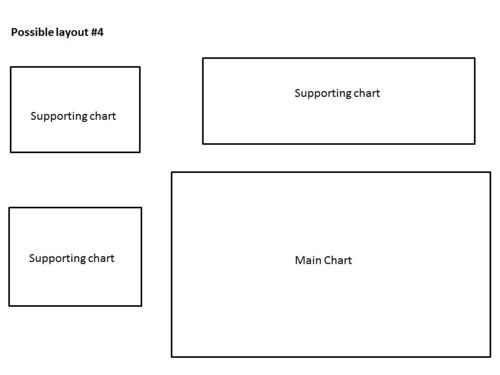
| − | | Layout acts as a blueprint for dashboard design || | + | | Layout acts as a blueprint for dashboard design || '''Not Available Yet''' ||[[File:2014 1 Slide3.JPG|500px]] || [[File:2014 1 Slide4.JPG|500px]] || [[File:2014 1 Slide5.JPG|500px]]|| [[File:2014 1 Slide6.JPG|500px]]|| Example || Example |
|- | |- | ||
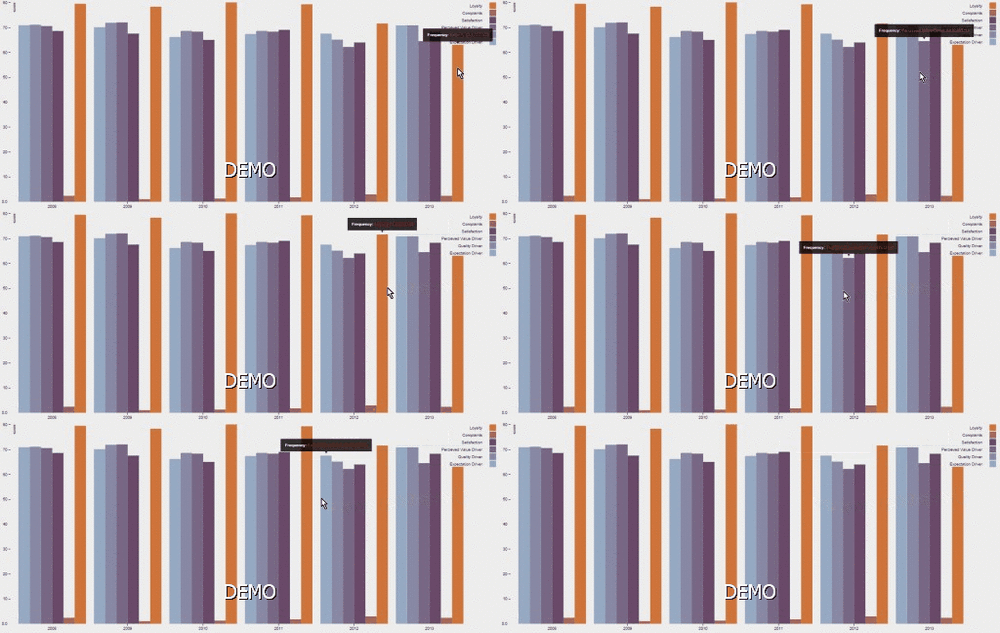
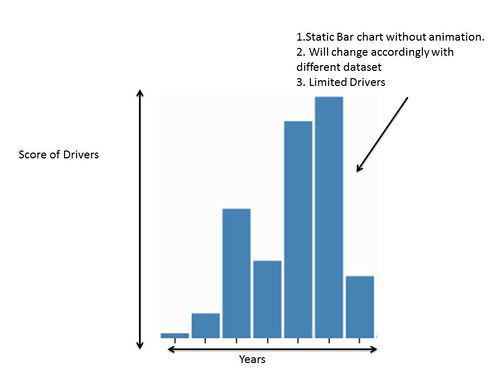
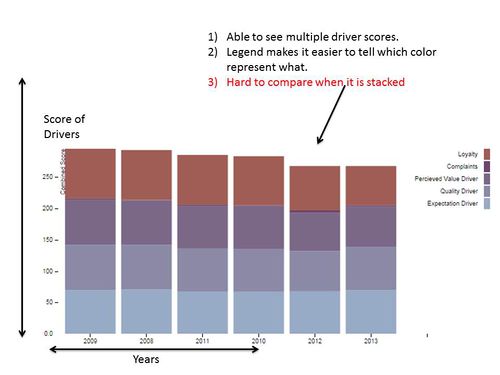
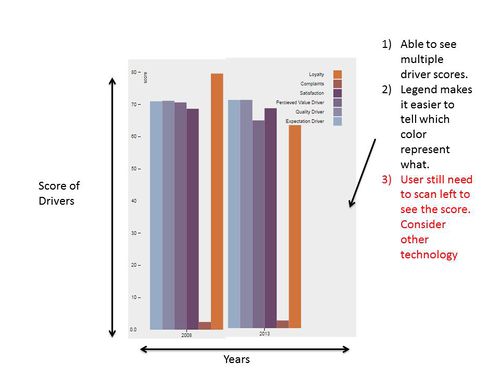
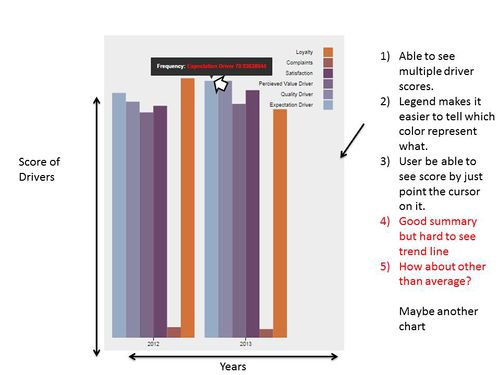
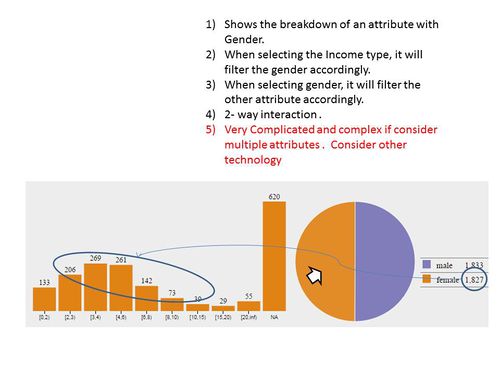
| Bar Chart to show quick overview of the current scores || [[File:2014 gif 1.gif|500px]] || [[File:2014 1 Slide7.JPG|500px]]|| [[File:2014 1 Slide8.JPG|500px]]|| [[File:2014 1 Slide9.JPG|500px]]|| [[File:2014 1 Slide10.JPG|500px]]|| Example | | Bar Chart to show quick overview of the current scores || [[File:2014 gif 1.gif|500px]] || [[File:2014 1 Slide7.JPG|500px]]|| [[File:2014 1 Slide8.JPG|500px]]|| [[File:2014 1 Slide9.JPG|500px]]|| [[File:2014 1 Slide10.JPG|500px]]|| Example | ||
|- | |- | ||
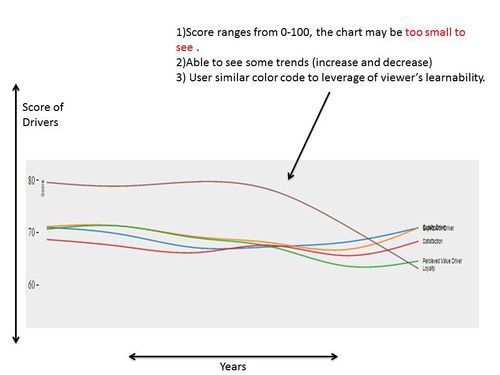
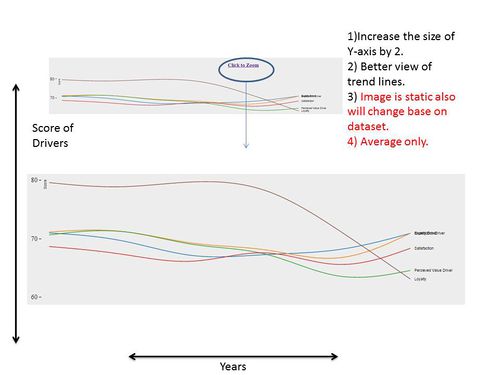
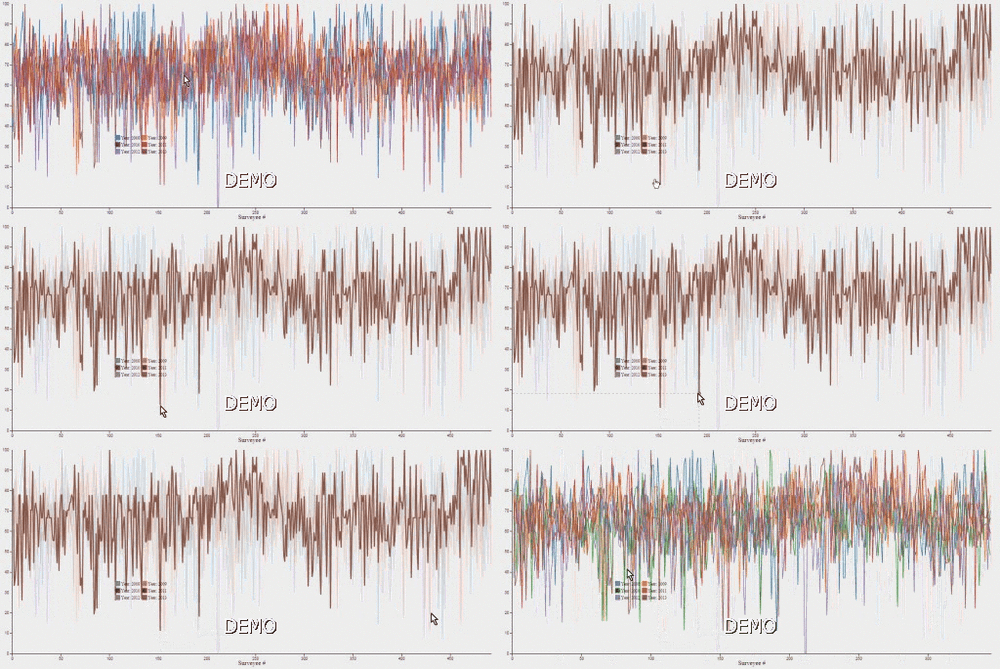
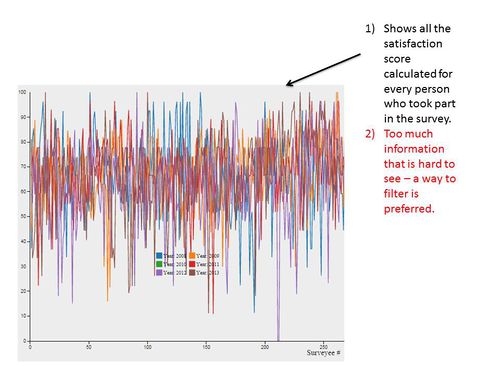
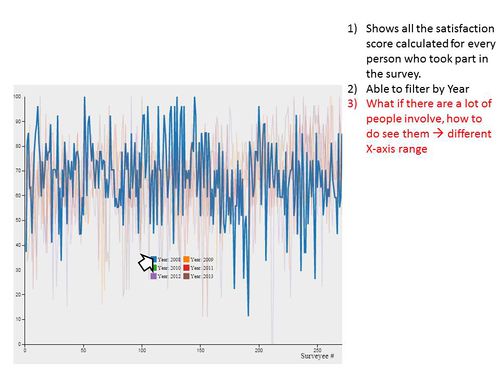
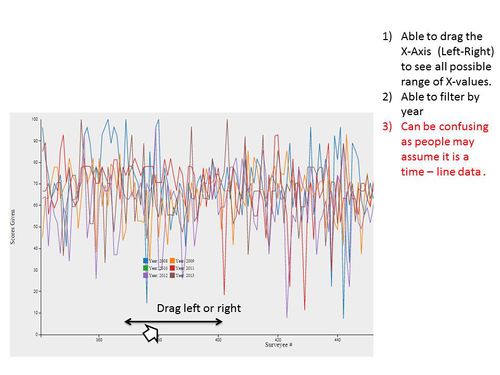
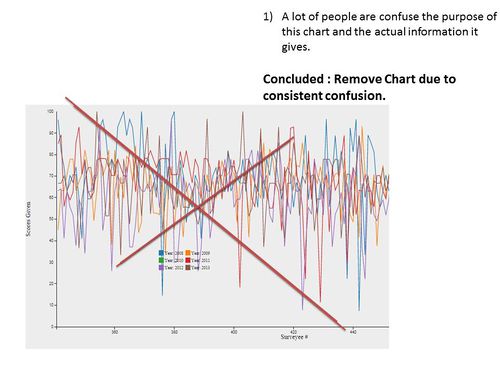
| − | | Line Chart allows recognition of pattern better than bar chart.|| | + | | Line Chart allows recognition of pattern better than bar chart.|| '''Not Available Yet''' || [[File:2014 1 Slide11.JPG|500px]]|| [[File:2014 1 Slide12.JPG|500px]]|| Example || Example || Example || Example |
|- | |- | ||
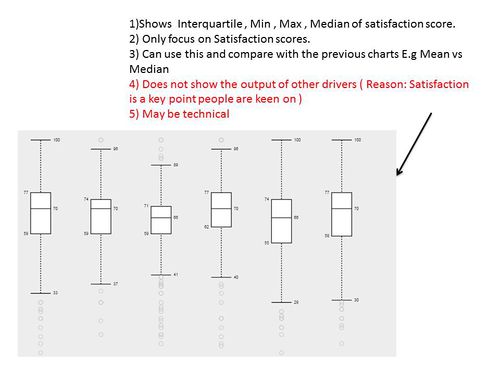
| − | | Box Plot to show more details that is not shown in bar/line chart.|| | + | | Box Plot to show more details that is not shown in bar/line chart.|| '''Not Available Yet''' || [[File:2014 1 Slide13.JPG|500px]]|| Example || Example || Example || Example || Example |
|- | |- | ||
| Dash Board - working towards a end product|| [[File:2014 gif 2.gif|500px]] || [[File:2014 1 Slide14.JPG|500px]]|| [[File:2014 1 Slide15.JPG|500px]]|| [[File:2014 1 Slide16.JPG|500px]]|| [[File:2014 1 Slide17.JPG|500px]]|| Example || Example | | Dash Board - working towards a end product|| [[File:2014 gif 2.gif|500px]] || [[File:2014 1 Slide14.JPG|500px]]|| [[File:2014 1 Slide15.JPG|500px]]|| [[File:2014 1 Slide16.JPG|500px]]|| [[File:2014 1 Slide17.JPG|500px]]|| Example || Example | ||
Revision as of 00:31, 28 September 2014
| Home | Project Overview | Documentation |
Stake holders
Supervisor : Daniel
Supervisor : Choksi Seema.
Client : Marcus Lee .
Development of Chart and Dashboards
Our dashboard has gone through many iterations of user testing and interactive design prototyping. The outcome of those are documented in this section
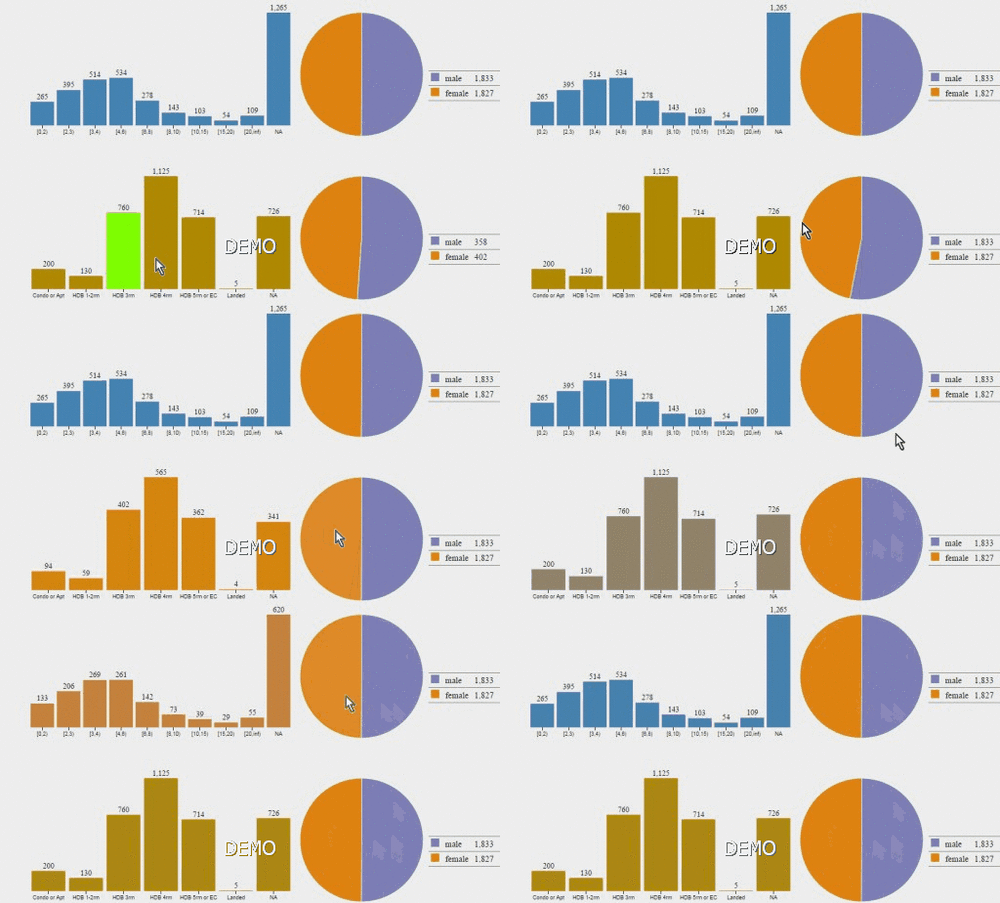
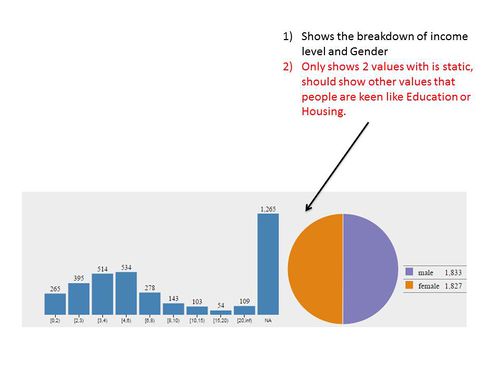
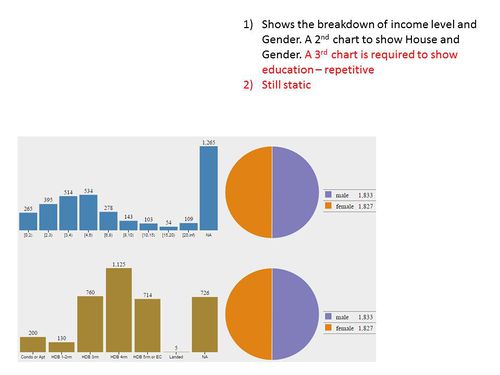
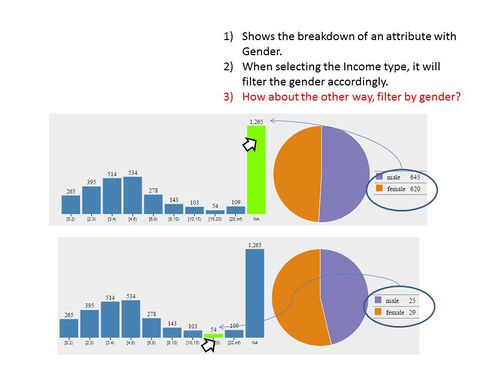
Version A -- Z shows the progression for the charts. Demo version shows the up to date / Best version available.
The sequence of the charts are also the placed in Chronological order based on what was created first.
