Difference between revisions of "Visualization of Consumer Satisfaction"
Jump to navigation
Jump to search
| Line 28: | Line 28: | ||
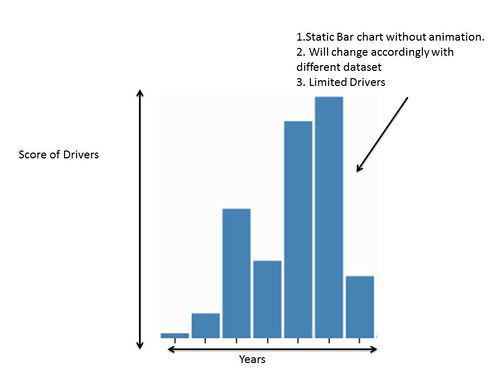
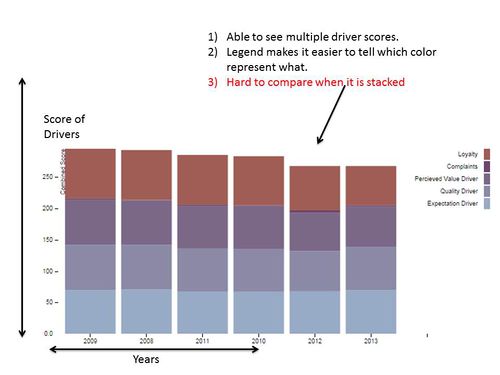
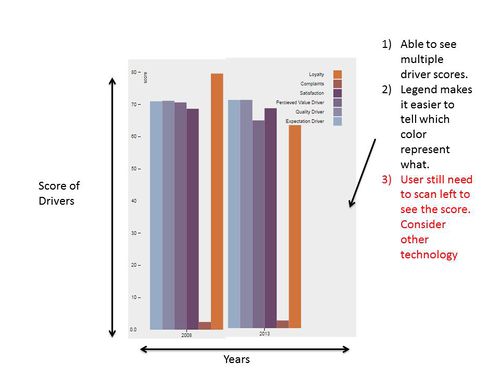
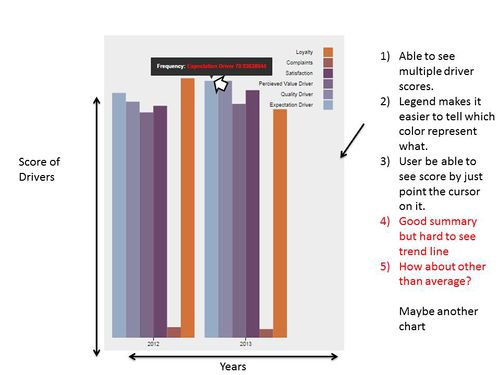
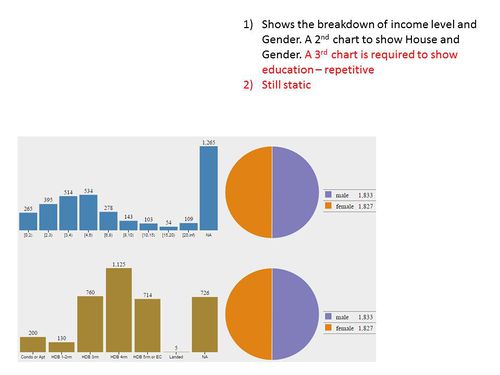
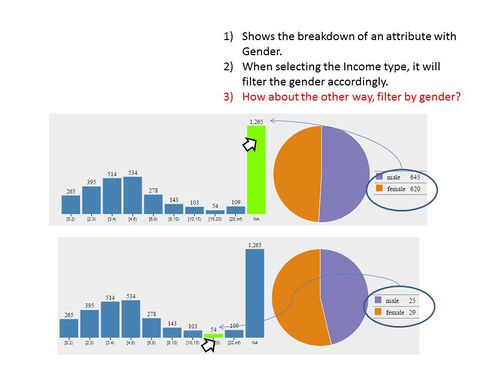
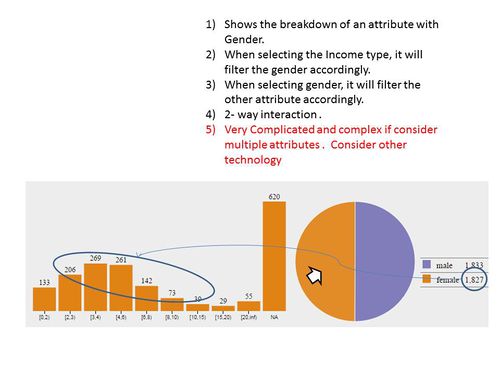
| Bar Chart || [[File:2014 1 Slide7.JPG|500px]]|| [[File:2014 1 Slide8.JPG|500px]]|| [[File:2014 1 Slide9.JPG|500px]]|| [[File:2014 1 Slide10.JPG|500px]]|| Example || Example | | Bar Chart || [[File:2014 1 Slide7.JPG|500px]]|| [[File:2014 1 Slide8.JPG|500px]]|| [[File:2014 1 Slide9.JPG|500px]]|| [[File:2014 1 Slide10.JPG|500px]]|| Example || Example | ||
|- | |- | ||
| − | | | + | | Line Chart|| [[File:2014 1 Slide11.JPG|500px]]|| [[File:2014 1 Slide12.JPG|500px]]|| Example || Example || Example || Example |
|- | |- | ||
| − | | | + | | Box Plot || [[File:2014 1 Slide13.JPG|500px]]|| Example || Example || Example || Example || Example |
|- | |- | ||
| − | | | + | | Dash Board Alpha|| [[File:2014 1 Slide14.JPG|500px]]|| [[File:2014 1 Slide15.JPG|500px]]|| [[File:2014 1 Slide16.JPG|500px]]|| [[File:2014 1 Slide17.JPG|500px]]|| Example || Example |
|- | |- | ||
| Example || Example || Example || Example || Example || Example || Example | | Example || Example || Example || Example || Example || Example || Example | ||
Revision as of 16:20, 27 September 2014
| Home | Project Overview | Documentation |
Current Progress
Week 6: Developing prototype for dashboard
Weekly Progress
| Week # | Supervisor Meeting | Sponsor Meeting | Progress Status | Changes & Updates | Follow up Actions |
|---|---|---|---|---|---|
| 5 | Wednesday, 17th September 2014 at Prof Seema's office | - | Meeting with supervisor to give weekly update | Showed Prof Seema our progress and samples of charts developed for the prototype of the dashboard. | Continue development of prototype of charts based on comments from Prof Seema and Daniel. There was no meeting with Marcus this week as our prototype was not ready. |
| 4 | Wednesday, 10th September 2014 at Prof Seema's office | - | Meeting with supervisor to give weekly update | Prof Seema gave suggestions on how to do analysis on the data with the demographic variables and also suggested types of charts for us to development for the prototype of the dashboard. | Proceed with data analysis on the data set with demographic variables and come up with prototype of the dashboard for review by sponsor and supervisor. |
| 4 | - | Wednesday, 10th September 2014 at Admin Building Level 9, Institute of Service Excellence | Meeting with sponsor to clarify questions and doubts on project | Received data set with demographic variables. Clarified questions on the development of the prototype for the dashboard. | Proceed with data analysis on the data set with demographic variables and come up with prototype of the dashboard for review by sponsor and supervisor. |
| 3 | Friday, 5th September 2014 at Prof Seema's office | - | Meeting with supervisor to give weekly update | Show Prof Seema and Daniel snippets of the data and explained to them aspects of the data. Prof Seema and Daniel gave suggestions as to how to draft and develop the dashboard. | To wait for dataset with demographic variables to be sent by Marcus and work on our Project Proposal to be due on 10th September. |
| 3 | - | Wednesday, 3rd September 2014 at Admin Building Level 9, Institute of Service Excellence | Meeting with sponsor to get the data | Signed the NDA and Yong Chang (team member from ISES) went through snippets of the data with us. He showed us the sample questionnaires that were used to collect the survey results and explained briefly the relationship between the indicators of customer satisfaction. | Marcus was still preparing the data for us and will send to us by this week. We received the data on Thursday night. |
| 2 | Wednesday, 27th August 2014 at Prof Seema's office | - | Gave Prof Seema updates on meeting with sponsor | Deadline for proposal submission will be postponed 1 week as we have not gotten the data | To push week 3's meeting to Friday if we have not gotten the data from sponsor by this week |
| 2 | - | Tuesday, 26th August 2014 at Admin Building Level 9, Institute of Service Excellence | Kick-off meeting with sponsor | Scheduled weekly meeting to be every Wednesday, 2pm - 3pm | Sponsor and his team will prepare NDA and data to be signed and given to us |
