Difference between revisions of "ANLY482 AY2017-18 T2 Group 16 LogisticRegression"
(Created page with "centre|1000px <!------- Main Navigation Bar----> <center> {| style="background-color:#ffffff ; margin: 3px 10px 3px 10px; width="80%"| | style="font-fam...") |
|||
| Line 28: | Line 28: | ||
<center> | <center> | ||
{| style="background-color:#ffffff ; margin: 3px 10px 3px 10px;" width="80%"| | {| style="background-color:#ffffff ; margin: 3px 10px 3px 10px;" width="80%"| | ||
| − | | style="font-family:Open Sans, Arial, sans-serif; font-size:15px; text-align: center; border:solid 1px #f5f5f5; background-color: # | + | | style="font-family:Open Sans, Arial, sans-serif; font-size:15px; text-align: center; border:solid 1px #f5f5f5; background-color: #f5f5f5" width="150px" | |
[[ANLY482_AY2017-18_T2_Group_16_Insights|<font color="#3c3c3c"><strong>EXPLORATORY DATA ANALYSIS</strong></font>]] | [[ANLY482_AY2017-18_T2_Group_16_Insights|<font color="#3c3c3c"><strong>EXPLORATORY DATA ANALYSIS</strong></font>]] | ||
| − | | style="font-family:Open Sans, Arial, sans-serif; font-size:15px; text-align: center; border:solid 1px #f5f5f5; background-color: # | + | | style="font-family:Open Sans, Arial, sans-serif; font-size:15px; text-align: center; border:solid 1px #f5f5f5; background-color: #fff" width="150px" | |
[[ANLY482_AY2017-18_T2_Group_16_LogisticRegression|<font color="#3c3c3c"><strong>LOGISTIC REGRESSION</strong></font>]] | [[ANLY482_AY2017-18_T2_Group_16_LogisticRegression|<font color="#3c3c3c"><strong>LOGISTIC REGRESSION</strong></font>]] | ||
Latest revision as of 00:39, 16 April 2018
Contents
Rationale for Logistic Regression
To identify the proper statistical method to identify factors influencing recruitment of new volunteers, we first had to understand variable New Volunteers itself. We realised that New Volunteers is not continuous in nature due to the definition of the variable. Another reason is that New Volunteers, as well as many of the potential explanatory variables, are not normally distributed and hence violate the assumption of normality, which is one of the assumptions when using linear regression.
Hence, for the purpose of our research question, we decided to investigate the failure and success of new volunteers. It may be summarized as:
1. What factors influence the failure to recruit new volunteers?
2. What factors influence the success in recruiting new volunteers?
Hence, we decided to create two new variables with binary outcomes to identify factors that led to failures and successes of recruitment.
Explanatory Factors
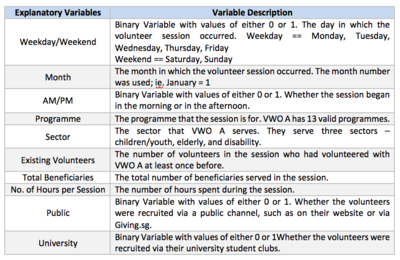
Again, because some of the variables are binary in nature, logistic regression may be more suitable model as it can test for binary outcomes. The potential factors are as follows:
Logistic Regression Method
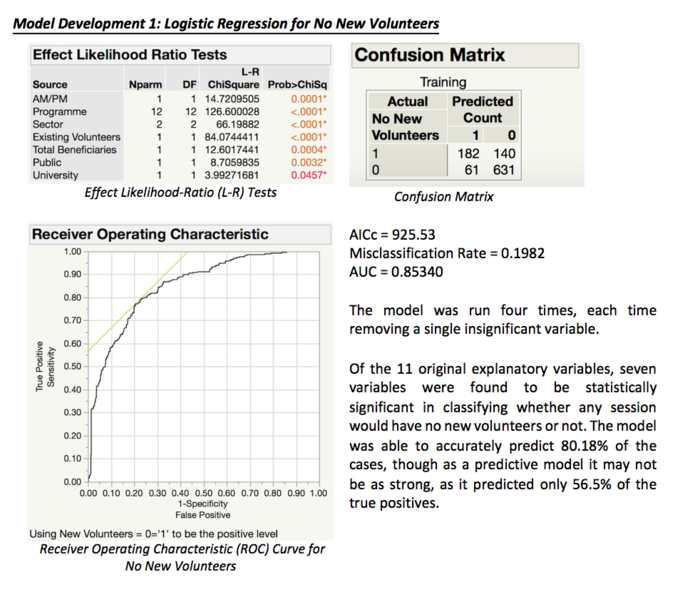
All models tested with these variables were significant in the Whole Model test and were not significant in the Lack of Fit test, which indicates whether the models were adequate. The Effect Likelihood Ratio Tests was used to evaluate the strength of the variables in predicting the probability of not having new volunteers.
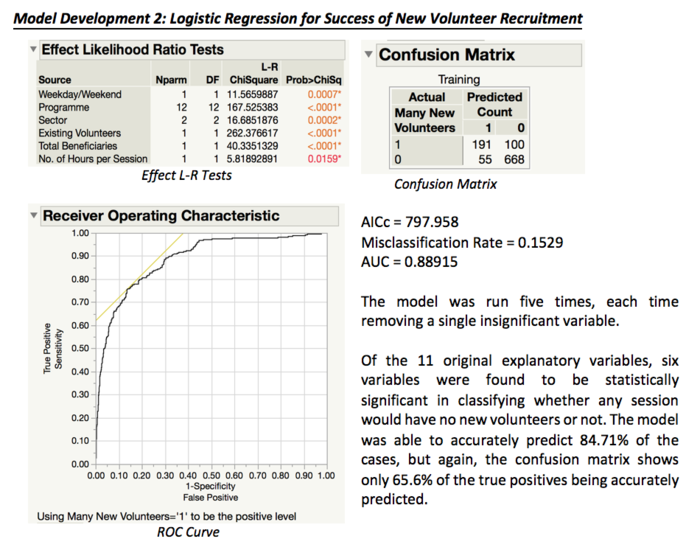
To evaluate the overall strength of the model, AICc (Akaike Information Criterion) and AUC (Area under the curve), as well as the misclassification rate, were used. AICc is used as relative comparison of goodness-to-fit between models; a lower AICc indicates a stronger model, but it does not indicate absolute goodness-to-fit of the model. Hence, the AUC is used as it is equal to the probability that the model will rank a randomly chosen positive instance higher than a randomly chosen negative one. Finally, the misclassification rate helps us understand the percentage of correct and incorrect predictions made by the model.
Variables were removed one by one (stepwise backward modelling), until the final model only has significant explanatory factors in the effect likelihood ratio.
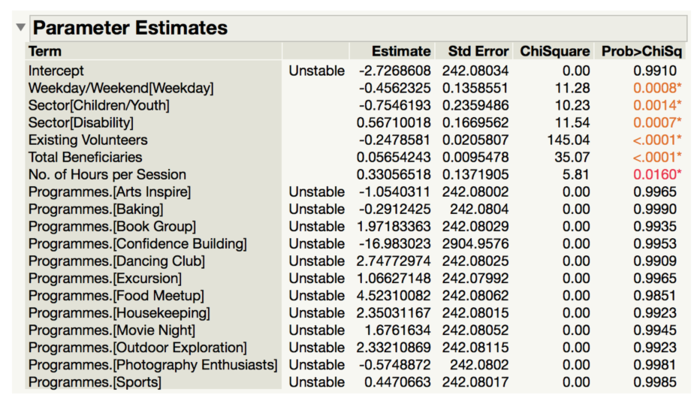
The final model included, in order of LogWorth – Programme, Existing Volunteers, Sector, AM/PM, Total Beneficiaries, Public, and University. We next studied the parameter estimates to understand the degree and the direction in which the explanatory factors affected the recruitment of new volunteers.
Model 1 - Failure to Recruit New Volunteers
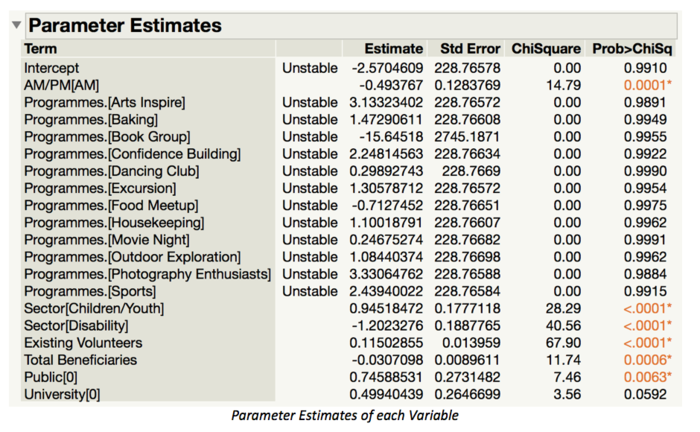
Based on the estimates, we may understand the direction and degree in which each variable affects the absence of new volunteers. For example, AM reflected a negative parameter estimate of -0.494 (p<0.0001), indicating that morning sessions decreased the probability of having no new volunteers. These have been summarized in the following table:
Note that University Volunteers was only slightly statistically significant in the L-R test and not significant in the parameter estimates. Hence, a conclusion will not be drawn for Public Volunteers. The elderly sector (the third of the sectors) was not significant in itself.


