ANLY482 AY2017-18 T2 Group 16 Insights
Literature Review
In the Singapore context, the government uses the VWOs to indirectly provide for those vulnerable in the society, without the need to directly use state resources to aid in self-sustenance. Government has a distinct indirect role in using the VWO to meet wider governmental goals, without directly providing to its citizens.
At the point of writing, there has not been extensive research done in Singapore context regarding recruitment of volunteers. The focus of research regarding the social services sector is mainly on finding the outcome for each programmes in general. This can be seen from a Straits Times Newspaper article where a new digital dashboard will be created to show “supply of social services meets the demand fuelled by social needs of different beneficiary groups”.
Logistic Regression has been attempted in the context of the social services sector, but not specifically on the recruitment of volunteers. Lee and Chang used Logistic Regression to “correctly explain and predict individuals' likelihood of making charitable donations” in Taiwan, and analyses which factors encourage people to donate. From the logistic regression, the factors affecting volunteerism are psychographic or attitudinal based factors”. Examples of these variables are “sense of social responsibility, empathy, and awareness and knowledge of NPOs (or non-profit organisations)”.
Exploratory Data Analysis
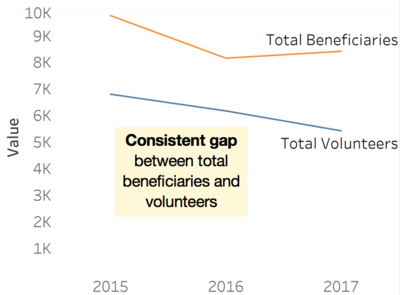
The number of beneficiaries and volunteers across the 13 programmes by the VWO in years 2015 - 2017 were observed.
First, the VWO experienced a gap between the total beneficiary and volunteer numbers. Volunteer numbers were compared to beneficiary numbers as the latter was used as a proxy of the expected volunteer numbers. This is because the VWO expects to adhere by the organisation standard of one volunteer to serve one beneficiary for the programmes. Hence, the fall in total volunteers, below the total beneficiary number, indicates a lower than expected number of volunteers. The specific programmes which contributed to this gap will be discussed later.
The VWO’s volunteers were also recruited in two different manners, from the general public (public volunteers) and from universities in Singapore (university volunteers). A decrease of 18.57% and 17.13% in 2016 and 2017 respectively, was observed when comparing the number of public volunteers with that of the previous year. From the table, we can also see that the percentage decrease in public volunteers in years 2016 and 2017 were much higher than the percentage decrease in total volunteers, thus indicating the public volunteer decrease is leading the decrease in total volunteers.
Volunteers also had different status: new and existing. New volunteers refer to volunteers who have never volunteered with the VWO before or last volunteered more than 2 years ago, while existing volunteers refer to those who have prior volunteer experience with the VWO. The decrease in new volunteers from the previous year were particularly high, with values of 20.62% in 2016 and 26.08% in 2017, which meant that VWO ‘s recruitment of new volunteers was becoming weaker over the years.
In sum, our exploratory analysis indicated a lower than expected total volunteer number and a decrease in the number of public volunteers and new volunteers over the three-year span. Hence, it surfaced the need to step up new volunteer recruitment. In the next section, the specific programmes that are lacking in volunteers will be discussed. This will be followed by the regression analysis which highlights the features in a programme that could bring in more new volunteers.
Beneficiaries and Volunteers
In this section, we measured the number of beneficiaries served by a single volunteer. This measure, named as the beneficiary-to-volunteer ratio, was simply a division of the number of beneficiaries by the number of volunteers in one activity session in a programme.
Programmes which had a beneficiary-volunteer ratio of 1 were considered even and otherwise, considered uneven (if one volunteer was serving more than one beneficiary or two volunteers were serving one beneficiary). The reason for upholding this ratio was to ensure that the beneficiary experience would not be compromised since a B:V ratio of 1:1 would allow the volunteer to give utmost attention to the beneficiary, unlike a situation where his attention is divided if he were tasked to care for 2 beneficiaries.
Since total beneficiaries was used as a proxy for the expected volunteers the organisation should aim to have, the programmes which had a beneficiary-volunteer ratio of more than one were programmes which require more new volunteers.
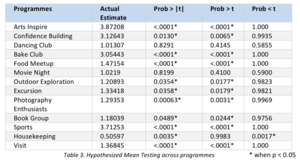
The following programmes: Arts Inspire, Confidence Building, Food Meetup, Outdoor Exploration, Excursion, Photography Enthusiasts, Book Group, Sports, and Visit have a higher Actual Estimate than the hypothesized mean. Also, it is statistically significant when testing for the hypothesized mean. Thus, it is safe to conclude, with 95% Confidence Interval, that the Actual Estimate is higher than the Hypothesized Mean. In practice, this means that for these aforementioned programmes, more than 1 beneficiary is being served by a single volunteer.
Based on the Means Testing, the Actual Estimates of the programmes Dancing Club and Movie Night are the closest to the Hypothesized mean. Also, these two programmes are not statistically significantly more than the mean. This also means that almost close to 1 beneficiary is being served by a single volunteer.
Although Bake Club and Housekeeping both have a higher Actual Estimate than the Hypothesized mean, we are excluding these two from the list. Due to the nature of these programs, our sponsor the VWO, did not explicitly desire for these two programmes to have a B:V ratio to be 1 and not any higher.


