Difference between revisions of "ANLY482 AY2017-18 T1 Group03/Project Overview"
Sohinid.2014 (talk | contribs) |
Sohinid.2014 (talk | contribs) |
||
| Line 61: | Line 61: | ||
From a business point of view, we aim to shed light on the following macro issue. We would like to find out which of the key resources (i.e. sales representatives, products, processes) drives sales and business performance for our client. Through this, we wish to help them gain a better insight on how they can allocate resources to maximise profit. This macro issue can be broken down into the following questions, which will aide us in providing a more comprehensive analysis for the client. | From a business point of view, we aim to shed light on the following macro issue. We would like to find out which of the key resources (i.e. sales representatives, products, processes) drives sales and business performance for our client. Through this, we wish to help them gain a better insight on how they can allocate resources to maximise profit. This macro issue can be broken down into the following questions, which will aide us in providing a more comprehensive analysis for the client. | ||
| − | + | *What is the best way to allocate limited resources, such as sales representatives, as compared to peddling via other channels such as telesales? | |
| − | + | *What is the optimal proportion, frequency and pattern of visits for various brands? | |
| − | + | *For different subcategories of channels, what is the optimal and required restock pattern? | |
| − | + | *What are the top 8-10 power brands that should be focused on in 2018 and through which channel are they best promoted? | |
These would help to provide a more focused sales effort for the client in 2018, and leading up to the industry trend of using big data to make better decisions to maximise revenue and provide better healthcare for the people (Healthcare 2020). To achieve the above business objectives, our analytical objectives are as follows: | These would help to provide a more focused sales effort for the client in 2018, and leading up to the industry trend of using big data to make better decisions to maximise revenue and provide better healthcare for the people (Healthcare 2020). To achieve the above business objectives, our analytical objectives are as follows: | ||
| Line 76: | Line 76: | ||
Lastly, from an industry point of view, it would be useful to understand if there are any difference in relationships within each subcategories defined by the industry. Some questions we feel would help are: | Lastly, from an industry point of view, it would be useful to understand if there are any difference in relationships within each subcategories defined by the industry. Some questions we feel would help are: | ||
| − | *Do clinics participating in the Community Health Assist Scheme (CHAS) experience a higher restock rate? | + | *Do clinics participating in the Community Health Assist Scheme (CHAS) experience a higher restock rate? |
*Do clinics in matured estates have a higher restock rate? | *Do clinics in matured estates have a higher restock rate? | ||
| Line 84: | Line 84: | ||
<div style="border-style: solid; border-width:0; background: #ff6600; padding: 7px; font-weight: bold; text-align:left; line-height: wrap_content; text-indent: 20px; font-size:20px; font-family:Century Gothic;border-bottom:5px solid white; border-top:5px solid black"><font color= #ffffff>Scope</font></div> | <div style="border-style: solid; border-width:0; background: #ff6600; padding: 7px; font-weight: bold; text-align:left; line-height: wrap_content; text-indent: 20px; font-size:20px; font-family:Century Gothic;border-bottom:5px solid white; border-top:5px solid black"><font color= #ffffff>Scope</font></div> | ||
<div style="background: #ffffff; text-align:left; line-height: wrap_content; text-indent: 0px; font-size:16px; font-family:Century Gothic"><font color= #000000> | <div style="background: #ffffff; text-align:left; line-height: wrap_content; text-indent: 0px; font-size:16px; font-family:Century Gothic"><font color= #000000> | ||
| + | In the validation of the current work done by the previous team, we would need to break down their findings into relationship pairs that they have examined, and from there derive any missing relationships between sales and various key resources that the client invests. This serves also as a primary sensitivity test, allowing us to better focus analytical efforts into areas which appear to have greater sensitivity. | ||
| + | |||
| + | The steps in detail are as follow: | ||
| + | [[Image:ScopeChart.png|800px|center]] | ||
| + | '''Problem Definition:''' | ||
| + | To sit down with client and to discuss about business problems that need to be solved. | ||
| + | |||
| + | '''Data Exploration:''' | ||
| + | To summarize the main characteristics of a dataset. | ||
| + | |||
| + | '''Data Preparation:''' | ||
| + | To collect, prepare, clean and integrate data into a suitable form for further analysis and processing. | ||
| + | |||
| + | '''Model Selection:''' | ||
| + | To come up with models based on the type of business problems that we are dealing with. | ||
| + | |||
| + | '''Model Validation:''' | ||
| + | To verify sensitivity analyses against resource-to-sales relationships as proposed in our model. | ||
| + | |||
| + | '''Model Development:''' | ||
| + | To build the most suitable model after validation is done and to test it against data we have on hand. | ||
| + | |||
| + | '''Communication of Results:''' | ||
| + | To use information displays such as tables and charts to help communicate key messages contained in the data to the client. | ||
| + | |||
| + | |||
</font></div> | </font></div> | ||
<div style="border-style: solid; border-width:0; background: #ff6600; padding: 7px; font-weight: bold; text-align:left; line-height: wrap_content; text-indent: 20px; font-size:20px; font-family:Century Gothic;border-bottom:5px solid white; border-top:5px solid black"><font color= #ffffff>Data</font></div> | <div style="border-style: solid; border-width:0; background: #ff6600; padding: 7px; font-weight: bold; text-align:left; line-height: wrap_content; text-indent: 20px; font-size:20px; font-family:Century Gothic;border-bottom:5px solid white; border-top:5px solid black"><font color= #ffffff>Data</font></div> | ||
| + | Our client will be supplying us with both current and prior year (2016) data. As Client X wants us to focus back on the same type of data from 2016, we will be provided with the same type of files and invoices but with the latest data. The type of files and invoices are summarised in the table below. | ||
| + | [[Image:DataTable.png|800px|center]] | ||
| + | We are currently waiting for the client to compile the latest data from 2017 as we have just signed the nondisclosure act form. | ||
| + | |||
</font></div><br> | </font></div><br> | ||
Revision as of 19:53, 27 August 2017
| Home | About Us | Project Overview | Midterm Progress | Final Progress | Project Management | Documentation |
Willy: I want to understand the field of application for data analytics in the real world practice. I also want to know how past data will have a direct influence over a company’s current and future performances. Since I am pursuing a career path in this field, this project will definitely be useful to me to better understand the growing trend in data analytics and how companies can leverage on such method to add value to both themselves and their stakeholders.
Cass: Since big data is one of the upcoming trends in the market, I am motivated to pick up this skill and explore why it is becoming an essential in every industry. Undertaking this project will not only allow me to practice using analytical tools on real data, it will also give me insight with regards to pursuing a career in the analytics field.
Sohini: Working with real life data in the pharmaceutical sector is extremely interesting as I had a desire to work closely with big data in this field. I want to learn more about the field of data analytics and also apply the concepts and applications i have learnt previously during my analytics internship. I hope to learn a lot about the tools and skills needed in analytics and also have a better understanding of the healthcare sector in Singapore. Finally, I just want to work closely with an actual company to have a better understanding of the working world of analytics.
Jon: I want to be exposed to the field of analytics and to learn about what the current perceived uses of analytics as a tool is in our daily world. I hope to be able to be at the forefront of applying it as a skill or tool to other industry processes in operations management, some of which might not even have been conceived today. 3.
From a business point of view, we aim to shed light on the following macro issue. We would like to find out which of the key resources (i.e. sales representatives, products, processes) drives sales and business performance for our client. Through this, we wish to help them gain a better insight on how they can allocate resources to maximise profit. This macro issue can be broken down into the following questions, which will aide us in providing a more comprehensive analysis for the client.
- What is the best way to allocate limited resources, such as sales representatives, as compared to peddling via other channels such as telesales?
- What is the optimal proportion, frequency and pattern of visits for various brands?
- For different subcategories of channels, what is the optimal and required restock pattern?
- What are the top 8-10 power brands that should be focused on in 2018 and through which channel are they best promoted?
These would help to provide a more focused sales effort for the client in 2018, and leading up to the industry trend of using big data to make better decisions to maximise revenue and provide better healthcare for the people (Healthcare 2020). To achieve the above business objectives, our analytical objectives are as follows:
- To use analytical methods to discover product and process sensitivity to sales.
- To formulate a robust and accurate framework of resource-to-resource relationship sensitivity, that will allow the client to better align business objectives to industry ecosystem relationships.
Lastly, from an industry point of view, it would be useful to understand if there are any difference in relationships within each subcategories defined by the industry. Some questions we feel would help are:
- Do clinics participating in the Community Health Assist Scheme (CHAS) experience a higher restock rate?
- Do clinics in matured estates have a higher restock rate?
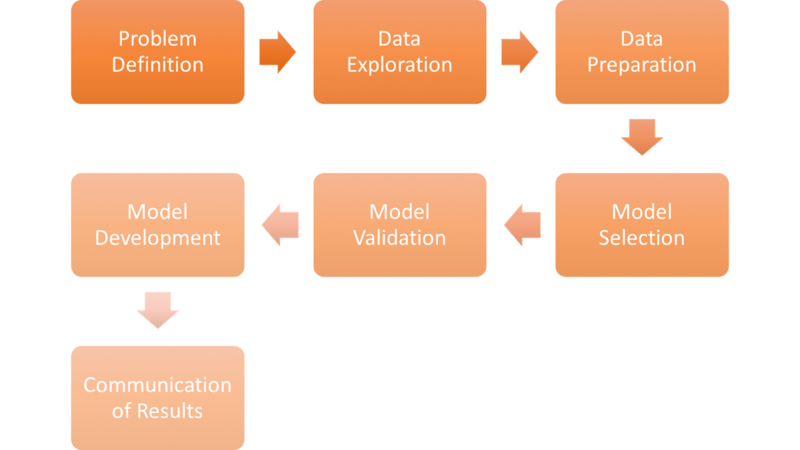
In the validation of the current work done by the previous team, we would need to break down their findings into relationship pairs that they have examined, and from there derive any missing relationships between sales and various key resources that the client invests. This serves also as a primary sensitivity test, allowing us to better focus analytical efforts into areas which appear to have greater sensitivity.
The steps in detail are as follow:
Problem Definition: To sit down with client and to discuss about business problems that need to be solved.
Data Exploration: To summarize the main characteristics of a dataset.
Data Preparation: To collect, prepare, clean and integrate data into a suitable form for further analysis and processing.
Model Selection: To come up with models based on the type of business problems that we are dealing with.
Model Validation: To verify sensitivity analyses against resource-to-sales relationships as proposed in our model.
Model Development: To build the most suitable model after validation is done and to test it against data we have on hand.
Communication of Results: To use information displays such as tables and charts to help communicate key messages contained in the data to the client.
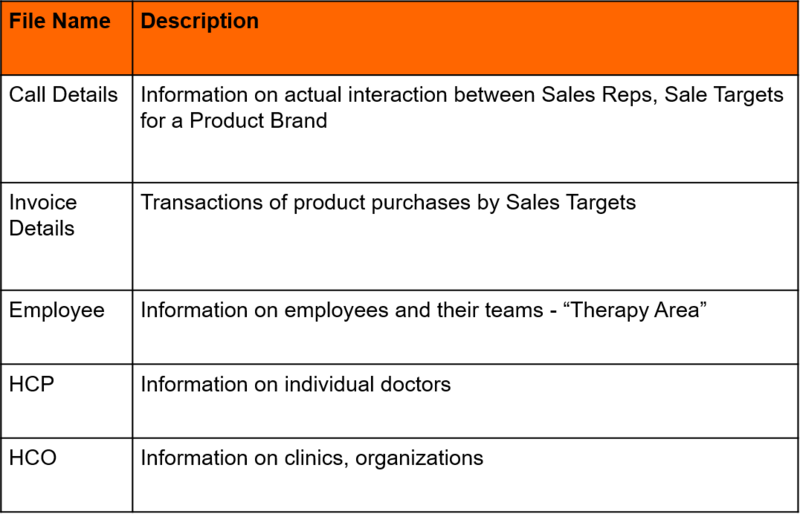
Our client will be supplying us with both current and prior year (2016) data. As Client X wants us to focus back on the same type of data from 2016, we will be provided with the same type of files and invoices but with the latest data. The type of files and invoices are summarised in the table below.
We are currently waiting for the client to compile the latest data from 2017 as we have just signed the nondisclosure act form.


