Difference between revisions of "Atom InterimProgress"
Sh.yan.2012 (talk | contribs) |
Sh.yan.2012 (talk | contribs) |
||
| Line 3: | Line 3: | ||
<!--Navigation--> | <!--Navigation--> | ||
{| style="background-color:#2980b9; color:#000000 padding: 5px 0 0 0;" width="100%" cellspacing="0" cellpadding="0" valign="top" border="0" | | {| style="background-color:#2980b9; color:#000000 padding: 5px 0 0 0;" width="100%" cellspacing="0" cellpadding="0" valign="top" border="0" | | ||
| − | | style="padding:0.3em; font-family:Helvetica; font-size:120%; border-bottom:2px solid # | + | | style="padding:0.3em; font-family:Helvetica; font-size:120%; border-bottom:2px solid #2980b9; border-top:2px solid #2980b9; border-left:2px solid #2980b9; background:#2980b9; text-align:center;" width="20%" | [[Image: AtomHome.png|40px|link=AY1516_T2_Team_Atom]] |
[[AY1516_T2_Team_Atom|<font color="#FFFFFF"><strong> Home </strong></font>]] | [[AY1516_T2_Team_Atom|<font color="#FFFFFF"><strong> Home </strong></font>]] | ||
| style="border-bottom:2px solid #2980b9; border-top:2px solid #2980b9; background:#2980b9;" width="1%" | | | style="border-bottom:2px solid #2980b9; border-top:2px solid #2980b9; background:#2980b9;" width="1%" | | ||
Revision as of 21:18, 28 February 2016
|
|
Contents
Revised Scope of work
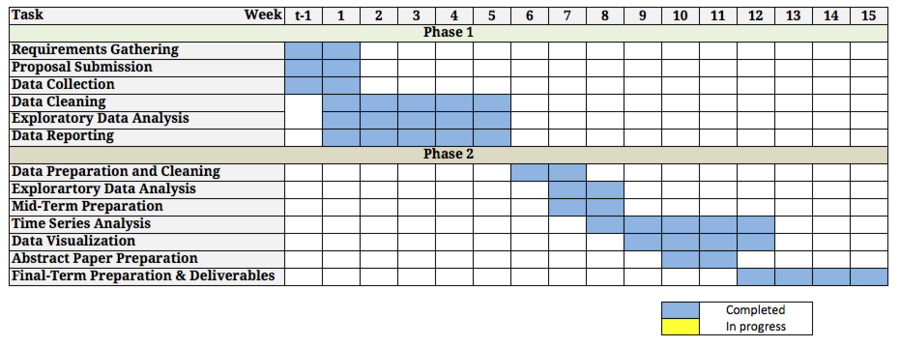
Phase 1 [Completed]
Phase 1 of the project will take place till end of January or when all the project reports and info-graphics are completed (whichever is earlier). We will be focusing on helping our project sponsor (MRC): -
• To ascertain parking demand and thereafter, to revise parking planning provision for sites
• To check for data errors and anomalies
• To generate charts and tables
• To generate infographics with the data given
• To identify significant trends (if any) and across relevant key categories
• To compare data percentages and correlations between car park demand and human traffic count
• To compare data percentages and correlations between the use of public transport and human traffic count
• To compile all generated data, charts and infographics into a written report
Phase 2
Phase 2 of the project will take place from February till the end of the course. We will be building a platform for data representation: -
• To compare the differnece occupancy rate between the sites
• To check for data errors and anomalies
• To generate charts and tables
• To generate infographics with the data given
• To identify significant trends (if any) and across relevant key categories
• To compile all generated data, charts and infographics into a written report
Review of Previous Work
Phase 1 [Completed]
Thus far, we have managed to complete phase 1 of the project in January, which is to assist MRC to understand the car park issues in 6 development sites (AMK hub, AMK hawker centre, Compass Point, Jalan Salang F&B cluster, Rail Mall F&B cluster and Sengkang CC). MRC has categorized AMK hub and AMK hawker centre to be grouped together initially as given between the two sites is pretty nearby to each other. Likewise for Compass Point and Sengkang CC to be grouped together to form Sengkang Cluster. As for the deliverables for phase 1, the team has analyzed and completed these deliverables for MRC:
Excel files:
1. AMK Hub.xlsx (7 tabs)
2. AMK Hawker Centre.xlsx (7 tabs)
3. Compass Point.xlsx (7 tabs)
4. Sengkang CC.xlsx (7 tabs)
5. Rail Mall.xlsx (7 tabs)
6. Jalan Salang.xlsx (7 tabs)
Report files:
1. AMK Cluster.pdf (82 pages)
2. SengKang.pdf (99 pages)
3. Rail Mall.pdf (87 pages)
4. Jalan Salang.pdf (62 pages)
Info-graphics files:
1. AMK Hub.pdf (7 slides)
2. AMK Hawker Centre.pdf (8 slides)
3. Compass Point.pdf (8 slides)
4. Sengkang CC.pdf (9 slides)
5. Rail Mall.pdf (11 slides)
6. Jalan Salang.pdf (11 slides)
The excel files are processed to assist in analyzing and plotting out the charts for the info-graphics. The reports are generated to share and report the insights found in the development. Lastly, the info-graphics documents are prepared to capture and share the main insights from the respective sites.
Due to the file size is too huge and it is unable to upload onto SMU elearn, please refer to https://wiki.smu.edu.sg/ANLY482/Atom%3A_Documentation#Phase_1 to view or download the file.
Phase 2
We will be utilizing the raw data provided by MRC to do more in depth analysis than what was required in Phase 1 of the project. Phase 1 did more of a summary of each parking site individually. In phase 2 we proposed time series data mining in order to identify and analyze any patterns that might exist between different parking sites, for example perhaps there might be a similarity between a retail mall in the east and west that might not be obvious from a superficial view of the data. Time series dating mining allows us to represent a collection of data that is obtained over a period of time, which allows us to view the shape of the data over time.
Revised Tools & Technology
Reporting Tools:
1. Microsoft Word
2. Microsoft PowerPoint
Analysis & Visualization Tools:
1. Microsoft Excel
2. SAS Enterprise Miner
3. JMP Pro
4. Microsoft SSIS (SQL Server Integration Services)
Collaboration tools:
1. Dropbox
2. Google Drive
3. SMU Wikipedia
Limitations and Assumptions
Revised Risk Assessment
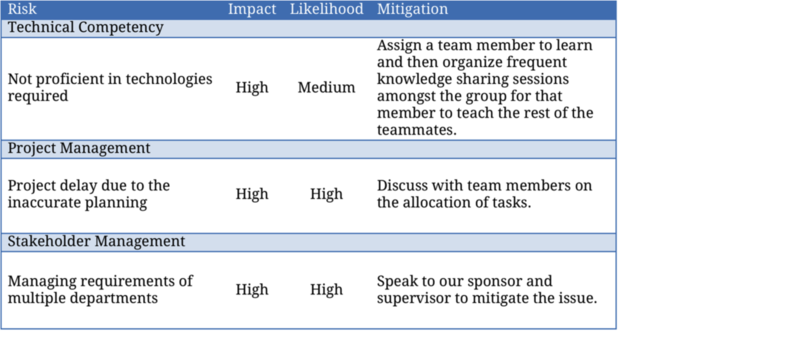
The team has identified technical competency, project management and stakeholder management as the highest impact risks, as shown below:

Revised Milestones & Deliverables
1. Team Wiki page [1]
2. Project Proposal (Week 1 – 10th Jan 2016)
3. Interim Progress Report (Week 8 – 28th Feb 2016)
4. Abstract Submission (Week 10 – 13th Mar 2016)
5. Full Paper Submission (Week 12 – 27th Mar 2016)
6. Final Paper Submission (Week 15 – 17th Apr 2016)
7. Final Term Presentation (Week 15 – 11th – 17th Apr 2016)
8. Poster (Week 16 – 21st Apr 2016)
Possible avenues for extension of project in the future
The team believed that the following ways would help improve the current project analysis and findings:
• Increase the scalability of the datasets without hindering on time and performance
• Increase the number of car park sites and other developments (HDB estate and etc.) into the analysis
• Increase the number of the days for observations


