Difference between revisions of "ANLY482 AY2016-17 T1 Group4: Project Overview"
Jump to navigation
Jump to search

(Created page with "<!--Logo--> center|1000x150px<br> <!--Header Start--> {|style="background-color:#4c5974; color:#F5F5F5; padding: 10 0 10 0;" width="100%" cells...") |
(Undo revision 11317 by Ranon.sim.2013 (talk)) |
||
| (23 intermediate revisions by 3 users not shown) | |||
| Line 3: | Line 3: | ||
<!--Header Start--> | <!--Header Start--> | ||
{|style="background-color:#4c5974; color:#F5F5F5; padding: 10 0 10 0;" width="100%" cellspacing="0" cellpadding="0" valign="top" border="0" | | {|style="background-color:#4c5974; color:#F5F5F5; padding: 10 0 10 0;" width="100%" cellspacing="0" cellpadding="0" valign="top" border="0" | | ||
| − | | style="padding:0.3em; font-size:100%; background-color:#4c5974; border-bottom:0px solid # | + | | style="padding:0.3em; font-size:100%; background-color:#4c5974; border-bottom:0px solid #3D9DD7; text-align:center; color:#F5F5F5" width="10%" | |
[[Image:TeamInsured_Home.png| 30px |link= ANLY482 AY2016-17 T1 Group4 ]] | [[Image:TeamInsured_Home.png| 30px |link= ANLY482 AY2016-17 T1 Group4 ]] | ||
| − | [[ANLY482 AY2016-17 T1 Group4 | + | [[ANLY482 AY2016-17 T1 Group4 |<font color="#F5F5F5" size=2><b>HOME</b></font>]] |
| style="border-bottom:0px solid #3D9DD7; background:none;" width="1%" | | | style="border-bottom:0px solid #3D9DD7; background:none;" width="1%" | | ||
| − | | style="padding:0.3em; font-size:100%; background-color:#ed881e; border-bottom:0px solid # | + | | style="padding:0.3em; font-size:100%; background-color:#ed881e; border-bottom:0px solid #1e708d; text-align:center; color:#F5F5F5" width="12%" | |
| − | [[Image:TeamInsured_About_Icon.png|30px|link= | + | [[Image:TeamInsured_About_Icon.png|30px|link=ANLY482 AY2016-17 T1 Group4: Project Overview ]] |
| − | [[ | + | [[ANLY482 AY2016-17 T1 Group4: Project Overview|<font color="#F5F5F5" size=2><b>PROJECT OVERVIEW</b></font>]] |
| style="border-bottom:0px solid #3D9DD7; background:none;" width="1%" | | | style="border-bottom:0px solid #3D9DD7; background:none;" width="1%" | | ||
| style="padding:0.3em; font-size:100%; background-color:#4c5974; border-bottom:0px solid #3D9DD7; text-align:center; color:#F5F5F5" width="12%" | | | style="padding:0.3em; font-size:100%; background-color:#4c5974; border-bottom:0px solid #3D9DD7; text-align:center; color:#F5F5F5" width="12%" | | ||
| − | [[Image:TeamInsured_Findings.png|30px|link= | + | [[Image:TeamInsured_Findings.png|30px|link=ANLY482 AY2016-17 T1 Group4: Findings]] |
| − | [[ | + | [[ANLY482 AY2016-17 T1 Group4: Project Findings |<font color="#F5F5F5" size=2><b>PROJECT FINDINGS</b></font>]] |
| style="border-bottom:0px solid #3D9DD7; background:none;" width="1%" | | | style="border-bottom:0px solid #3D9DD7; background:none;" width="1%" | | ||
| − | | style="padding:0.3em; font-size:100%; background-color:#4c5974; border-bottom:0px solid #3D9DD7; text-align:center; color:#F5F5F5" width=" | + | | style="padding:0.3em; font-size:100%; background-color:#4c5974; border-bottom:0px solid #3D9DD7; text-align:center; color:#F5F5F5" width="15%" | |
| − | [[Image:TeamInsured_PM.png|30px|link= | + | [[Image:TeamInsured_PM.png|30px|link=ANLY482 AY2016-17 T1 Group4: Project Management]] |
| − | [[ | + | [[ANLY482 AY2016-17 T1 Group4: Project Management |<font color="#F5F5F5" size=2><b>PROJECT MANAGEMENT</b></font>]] |
| style="border-bottom:0px solid #3D9DD7; background:none;" width="1%" | | | style="border-bottom:0px solid #3D9DD7; background:none;" width="1%" | | ||
| style="padding:0.3em; font-size:100%; background-color:#4c5974; border-bottom:0px solid #3D9DD7; text-align:center; color:#F5F5F5" width="10%" | | | style="padding:0.3em; font-size:100%; background-color:#4c5974; border-bottom:0px solid #3D9DD7; text-align:center; color:#F5F5F5" width="10%" | | ||
| − | [[Image:TeamInsured_Documentation.png|30px|link= | + | [[Image:TeamInsured_Documentation.png|30px|link=ANLY482 AY2016-17 T1 Group4: Documentation]] |
| − | [[ | + | [[ANLY482 AY2016-17 T1 Group4: Documentation | <font color="#F5F5F5" size=2><b>DOCUMENTATION</b></font>]] |
|} | |} | ||
<!--Header End--> | <!--Header End--> | ||
| Line 32: | Line 32: | ||
==Background== | ==Background== | ||
| + | At the insurance company, serving happiness to customers has always been the main focus. As such, we at Team Insured have been tasked to assist their customer base, specifically for the Life Insurance side of the business. | ||
| + | <br><br> | ||
| + | The three main things that the insurance company requires our help for to do analysis on: | ||
| + | * Average Product Holdings per Customer | ||
| + | * Customer Segmentation | ||
| + | * Agent Segmentation. | ||
| + | <br> | ||
| + | Deeper analysis such as Need Based Analysis has also been requested. These are the three general objectives that are to be pursued for this project, so as to help the insurance company understand their customers better. | ||
| + | <br> | ||
| + | |||
| + | ==Data Source== | ||
<br> | <br> | ||
| + | ===Nature of Dataset=== | ||
| + | |||
| + | The team was able to obtain ten different datasets from the main Database, of which eight were usable and relevant to our area of analysis (Actual table names have been masked for privacy's sake.) | ||
| + | |||
| + | *The first dataset “Client”, the primary Client dataset, contains approximately 510,000 rows of client records, with 105 unique columns, which came in a “.TXT” formatted flat file. | ||
| − | + | *The second dataset, “Contract”, that was provided was the contract header dataset that held each clients’ contract data, containing approximately 1.4 million rows of records, with 234 unique columns, which came in a “.TXT” formatted flat file. | |
| + | |||
| + | *The third dataset, “Life”, that was provided was the Life Insurance data that was linked to each contract, containing approximately 414,000 rows of records, with 27 unique columns, which came in a “.TXT” formatted flat file. | ||
| + | |||
| + | *The fourth dataset, “Coverage”, that was provided was the coverage data that was linked to each contract, containing approximately 2.86 million rows of records, with 102 unique columns, which came in a “.TXT” formatted flat file. | ||
| + | |||
| + | *The fifth dataset, “Agent”, that was provided was the agent data linked to each client, containing approximately 10800 rows of records, with 51 unique columns, which came in a “.TXT” formatted flat file. | ||
| + | |||
| + | *The sixth dataset, “Payer”, that was provided was the payee data linked to each contract, containing approximately 1.14 million rows of records, with 51 unique columns, which came in a “.TXT” formatted flat file. | ||
| + | |||
| + | *The seventh dataset, “ClientRel”, that was provided was a table linking agent data, client data and life insurance data together, containing approximately 2.482 million rows of records, with 11 unique columns, which came in a “.TXT” formatted flat file. | ||
| + | |||
| + | *The eighth dataset, “ClientExtra”, that was provided was the extra client data linked to each client, containing approximately 396,000 rows of records, with 21 unique columns, which came in a “.TXT” formatted flat file. | ||
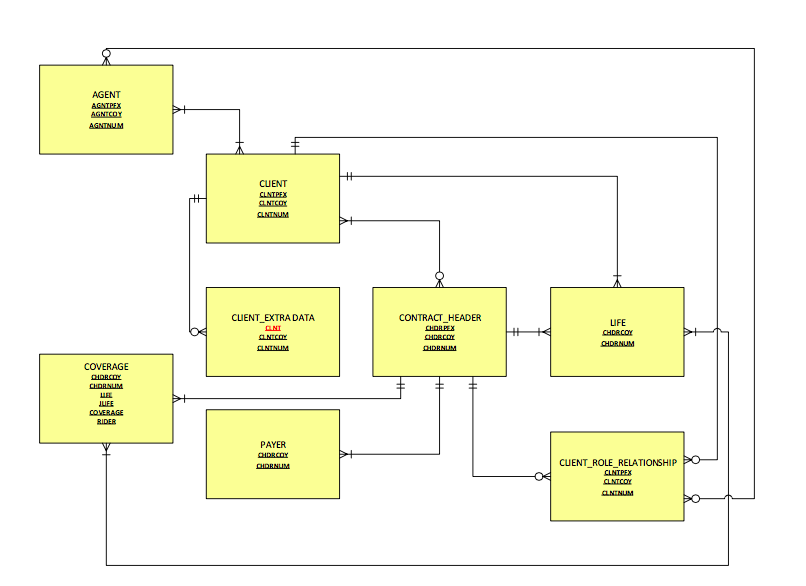
| + | ===ER Diagram=== | ||
| + | [[Image: Teaminsured_erdiagram.png | center]] | ||
<br> | <br> | ||
| Line 42: | Line 72: | ||
<br> | <br> | ||
| + | |||
| + | ===Cleaning and Merging=== | ||
| + | * The flat files were processed with Windows Powershell Scripts, to removed any accidental line breaks and escape characters. | ||
| + | * The files were then manually validated against a data dictionary (Word Document) and then loaded into SAS Enterprise Guide | ||
| + | * After that the files were merged inside SAS EG and Exported as SAS7BAT files, to be analysed by the team. | ||
| + | |||
| + | ===Exploratory Data Analysis=== | ||
| + | * We used SAS Entreprise Guide for our Exploratory Data Analysis. | ||
<!--Body End--> | <!--Body End--> | ||
Latest revision as of 19:01, 31 December 2016
Contents
Background
At the insurance company, serving happiness to customers has always been the main focus. As such, we at Team Insured have been tasked to assist their customer base, specifically for the Life Insurance side of the business.
The three main things that the insurance company requires our help for to do analysis on:
- Average Product Holdings per Customer
- Customer Segmentation
- Agent Segmentation.
Deeper analysis such as Need Based Analysis has also been requested. These are the three general objectives that are to be pursued for this project, so as to help the insurance company understand their customers better.
Data Source
Nature of Dataset
The team was able to obtain ten different datasets from the main Database, of which eight were usable and relevant to our area of analysis (Actual table names have been masked for privacy's sake.)
- The first dataset “Client”, the primary Client dataset, contains approximately 510,000 rows of client records, with 105 unique columns, which came in a “.TXT” formatted flat file.
- The second dataset, “Contract”, that was provided was the contract header dataset that held each clients’ contract data, containing approximately 1.4 million rows of records, with 234 unique columns, which came in a “.TXT” formatted flat file.
- The third dataset, “Life”, that was provided was the Life Insurance data that was linked to each contract, containing approximately 414,000 rows of records, with 27 unique columns, which came in a “.TXT” formatted flat file.
- The fourth dataset, “Coverage”, that was provided was the coverage data that was linked to each contract, containing approximately 2.86 million rows of records, with 102 unique columns, which came in a “.TXT” formatted flat file.
- The fifth dataset, “Agent”, that was provided was the agent data linked to each client, containing approximately 10800 rows of records, with 51 unique columns, which came in a “.TXT” formatted flat file.
- The sixth dataset, “Payer”, that was provided was the payee data linked to each contract, containing approximately 1.14 million rows of records, with 51 unique columns, which came in a “.TXT” formatted flat file.
- The seventh dataset, “ClientRel”, that was provided was a table linking agent data, client data and life insurance data together, containing approximately 2.482 million rows of records, with 11 unique columns, which came in a “.TXT” formatted flat file.
- The eighth dataset, “ClientExtra”, that was provided was the extra client data linked to each client, containing approximately 396,000 rows of records, with 21 unique columns, which came in a “.TXT” formatted flat file.
ER Diagram

Methodology
Cleaning and Merging
- The flat files were processed with Windows Powershell Scripts, to removed any accidental line breaks and escape characters.
- The files were then manually validated against a data dictionary (Word Document) and then loaded into SAS Enterprise Guide
- After that the files were merged inside SAS EG and Exported as SAS7BAT files, to be analysed by the team.
Exploratory Data Analysis
- We used SAS Entreprise Guide for our Exploratory Data Analysis.