Difference between revisions of "Visualization of Consumer Satisfaction"
Jump to navigation
Jump to search
| (53 intermediate revisions by 2 users not shown) | |||
| Line 5: | Line 5: | ||
| style="border-bottom:4px solid #B18904; border-top:5px solid #B18904; background:none;" width="1%" | | | style="border-bottom:4px solid #B18904; border-top:5px solid #B18904; background:none;" width="1%" | | ||
| style="padding:0.4em; font-size:150%; background-color:#FFFFFF; border-bottom:4px solid #B18904; border-top:5px solid #B18904; text-align:center; color:#828282" width="10%" | [[Visualization of Consumer Satisfaction Project Overview |<font color="#0B0B61" size=2><b>Project Overview</b></font>]] | | style="padding:0.4em; font-size:150%; background-color:#FFFFFF; border-bottom:4px solid #B18904; border-top:5px solid #B18904; text-align:center; color:#828282" width="10%" | [[Visualization of Consumer Satisfaction Project Overview |<font color="#0B0B61" size=2><b>Project Overview</b></font>]] | ||
| + | |||
| + | | style="border-bottom:4px solid #B18904; border-top:5px solid #B18904; background:none;" width="1%" | | ||
| + | | style="padding:0.4em; font-size:150%; background-color:#FFFFFF; border-bottom:4px solid #B18904; border-top:5px solid #B18904; text-align:center; color:#828282" width="10%" | [[Visualization of Consumer Satisfaction Progress |<font color="#0B0B61" size=2><b>Progress</b></font>]] | ||
| + | |||
| + | | style="border-bottom:4px solid #B18904; border-top:5px solid #B18904; background:none;" width="1%" | | ||
| + | | style="padding:0.4em; font-size:150%; background-color:#FFFFFF; border-bottom:4px solid #B18904; border-top:5px solid #B18904; text-align:center; color:#828282" width="10%" | [[Visualization of Consumer Satisfaction Mid-Term Progress |<font color="#0B0B61" size=2><b>Mid-Term Progress</b></font>]] | ||
| style="border-bottom:4px solid #B18904; border-top:5px solid #B18904; background:none;" width="1%" | | | style="border-bottom:4px solid #B18904; border-top:5px solid #B18904; background:none;" width="1%" | | ||
| Line 11: | Line 17: | ||
<!-- End of header --> | <!-- End of header --> | ||
| − | == <div style="background: # | + | {| style="text-align: center; width: 100%;" |
| − | + | |- | |
| + | |valign=top width=50%|<div class="NavHead" style="background-color:#DBA901;; text-align: center; padding: 5px; font-size: 120%; border:solid 2px #DBA901;"><span style="color: #0B0B61"> '''Stakeholders''' </span></div> | ||
| + | <div style="text-align: center;"> | ||
| + | <br> | ||
Supervisor : [http://sis.smu.edu.sg/faculty/profile/83109/Seema%20CHOKSHI Seema Chokshi] <br> | Supervisor : [http://sis.smu.edu.sg/faculty/profile/83109/Seema%20CHOKSHI Seema Chokshi] <br> | ||
| − | |||
Sponsor : [http://www.smu.edu.sg/faculty/profile/9505/Marcus%20LEE Marcus Lee] | Sponsor : [http://www.smu.edu.sg/faculty/profile/9505/Marcus%20LEE Marcus Lee] | ||
| − | == <div style="background: # | + | |valign=top width=50%|<div class="NavHead" style="background-color:#DBA901;; text-align: center; padding: 5px; font-size: 120%; border:solid 2px #DBA901;"><span style="color: #0B0B61"> ''' Project Team Members''' </span></div> |
| + | <div style="text-align: center;"> | ||
| + | <br> | ||
| + | [[Mohamed Yousof Bin Shamsul Hameed]]<br> | ||
| + | [[Kee Eng Sen]] | ||
| − | + | |} | |
| − | === | + | {| style="text-align: center; width: 100%;" |
| + | |- | ||
| + | |valign=top width=30%|<div class="NavHead" style="background-color:#DBA901;; text-align: center; padding: 5px; font-size: 120%; border:solid 2px #DBA901;"><span style="color: #0B0B61"> '''Milestone Status''' </span></div> | ||
| + | <div style="text-align: center;"> | ||
| + | <br> | ||
| + | <strike> Project Proposal <br>'''3-Sep-2014'''</strike> <br><br> | ||
| + | <strike> Mid-Term Presentation and Report <br>'''8-Oct-2014'''</strike> <br><br> | ||
| + | Poster and Report Submission <br>'''19-Nov-2014'''<br><br> | ||
| + | <strike>Final Presentation <br>'''12-Nov-2014'''</strike><br><br> | ||
| − | + | |valign=top width=25%|<div class="NavHead" style="background-color:#DBA901;; text-align: center; padding: 5px; font-size: 120%; border:solid 2px #DBA901;"><span style="color: #0B0B61"> ''' Meeting Status ''' </span></div> | |
| + | <div style="text-align: center;"> | ||
| + | <br> | ||
| + | Last Supervisor Meeting <br>'''12-Nov-2014'''<br><br> | ||
| − | + | Last Sponsor Meeting <br>'''5-Nov-2014'''<br><br> | |
| − | + | Next Sponsor Meeting <br>'''-'''<br><br> | |
| − | + | |valign=top width=44%|<div class="NavHead" style="background-color:#DBA901; text-align: center; padding: 5px; font-size: 120%; border:solid 2px #DBA901;"><span style="color: #0B0B61"> '''Project Status''' </span></div> | |
| − | + | <div style="text-align: center;"> | |
| − | + | <b>Current Iteration</b><br> | |
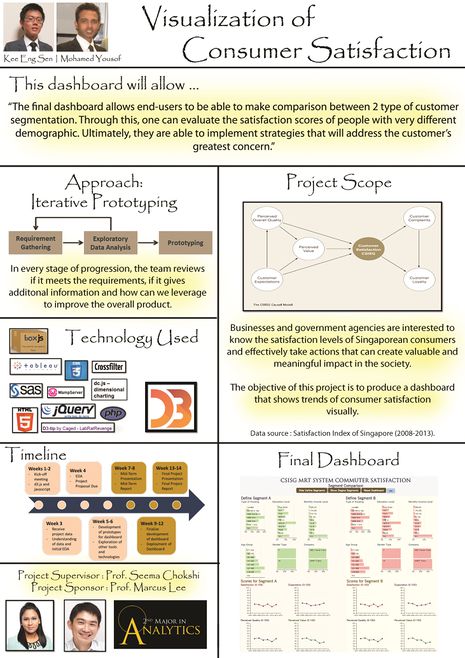
| − | + | [[File:2014 visual POSTER low res.jpg|465px]] | |
| − | <center> [[File:2014 | ||
| − | + | <br><br><br> | |
| − | + | ---- | |
| − | + | * Status updates inspired by [https://wiki.smu.edu.sg/is480/IS480_Team_wiki:_2013T2_GENShYFT IS480 FYP Team GENShYFT] | |
| − | + | |} | |
| − | |||
| − | |||
| − | < | ||
| − | |||
| − | |||
| − | |||
| − | |||
| − | |||
| − | |||
| − | |||
| − | |||
| − | |||
| − | |||
| − | |||
| − | |||
| − | |||
| − | |||
| − | |||
| − | |||
| − | |||
| − | |||
| − | |||
| − | |||
| − | |||
| − | |||
| − | |||
| − | |||
| − | |||
Latest revision as of 15:37, 12 November 2014
| Home | Project Overview | Progress | Mid-Term Progress | Documentation |
Stakeholders
|
Project Team Members
|
Milestone Status
|
Meeting Status
Last Sponsor Meeting Next Sponsor Meeting |
Project Status
|
