Difference between revisions of "Network Analysis of Interlocking Directorates/Findings Insights"
| (26 intermediate revisions by 2 users not shown) | |||
| Line 3: | Line 3: | ||
{|style="background-color:#ffffff; color:#000000" width="100%" cellspacing="0" cellpadding="10" valign="top" border="0"| | {|style="background-color:#ffffff; color:#000000" width="100%" cellspacing="0" cellpadding="10" valign="top" border="0"| | ||
|style="font-size:100%; border-left:1px solid #ffffff; border-right:1px solid #ffffff; text-align:center; background-color:#151C55; " width="10%" |[[Network_Analysis_of_Interlocking_Directorates|<font color="#ffffff"><b>Home</b></font>]] | |style="font-size:100%; border-left:1px solid #ffffff; border-right:1px solid #ffffff; text-align:center; background-color:#151C55; " width="10%" |[[Network_Analysis_of_Interlocking_Directorates|<font color="#ffffff"><b>Home</b></font>]] | ||
| − | |style="font-size:100%; border-left:1px solid #ffffff; border-right:1px solid #ffffff; text-align:center; background-color:#151C55; " width="10%" |[[Network_Analysis_of_Interlocking_Directorates/Project_Overview|<font color="#ffffff"><b>Project | + | |style="font-size:100%; border-left:1px solid #ffffff; border-right:1px solid #ffffff; text-align:center; background-color:#151C55; " width="10%" |[[Network_Analysis_of_Interlocking_Directorates/Project_Overview|<font color="#ffffff"><b>Project Methodology</b></font>]] |
|style="font-size:100%; border-left:1px solid #ffffff; border-right:1px solid #ffffff; text-align:center; background-color:#8A740C; " width="10%" |[[Network_Analysis_of_Interlocking_Directorates/Findings_Insights|<font color="#ffffff"><b>Findings & Insights</b></font>]] | |style="font-size:100%; border-left:1px solid #ffffff; border-right:1px solid #ffffff; text-align:center; background-color:#8A740C; " width="10%" |[[Network_Analysis_of_Interlocking_Directorates/Findings_Insights|<font color="#ffffff"><b>Findings & Insights</b></font>]] | ||
|style="font-size:100%; border-left:1px solid #ffffff; border-right:1px solid #ffffff; text-align:center; background-color:#151C55; " width="10%" |[[Network_Analysis_of_Interlocking_Directorates/Project_Management|<font color="#ffffff"><b>Project Management</b></font>]] | |style="font-size:100%; border-left:1px solid #ffffff; border-right:1px solid #ffffff; text-align:center; background-color:#151C55; " width="10%" |[[Network_Analysis_of_Interlocking_Directorates/Project_Management|<font color="#ffffff"><b>Project Management</b></font>]] | ||
| Line 11: | Line 11: | ||
<!--End Navigation Bar--> | <!--End Navigation Bar--> | ||
| − | < | + | =<font face="Corbel" color= #8A740C> Duality of Interlocking Directorates </font>= |
| − | <font size = 3px> | + | <font size=3px> |
| − | + | ||
| − | + | '''Visualization process:''' | |
| − | [[File: | + | |
| − | + | We used Gephi, a data visual analytics tool, to visualize the interlocking directorates network. Gephi is also an open source interactive network exploration visualization. We also did the experiments on another visualization software - NodeXL, yet because Gephi proved to be stronger in processing large data, eventually I mostly use Gephi to generate the graphs. | |
| − | + | ||
| + | The visualization process in Gephi requires a lot of trials and errors in adjusting the properties to come up with meaningful graphs, which are useful for fraud risk assessment analysis. The first graph we generated was a group of gray nodes which cannot express any insights at all (Graph 4.3.1 - Gephi 1st visualization). Because the network contains of directors and companies, which should be displayed differently in the network, we separate them by color coding: the nodes in red represent the company, and those in blue represent the executives (Graph 4.3.2 - Gephi 2nd visualization). | ||
| + | |||
| + | After color coding the nodes, it was still difficult to see the connections between them, so we managed to rank the nodes according to its betweenness centrality, so the nodes with higher betweenness centrality scores will be displayed as bigger than those with lower scores. I also carefully considered different layout and display options to come up with the final layouts, which will be discussed in the next section. | ||
| + | |||
| + | [[File:Gephi 3.png]] | ||
| + | |||
| + | '''Results:''' | ||
| + | |||
| + | '''Full Network Visualization:''' | ||
| + | |||
| + | Graph 5.1.1. represents the whole Singapore interlocking directorates network. The red color nodes represent the companies, and blue color represent the directors. The sizes of the nodes are ranked according to betweenness centrality; the bigger the node is, the higher betweenness centrality score it has. A high betweenness centrality might suggest that the individual is connecting various different parts of the network together; hence, the big nodes are expected to hold more control and influence over the network. Nodes around the edge of the network are typically have a low betweenness centrality. This whole network visualization allows us to broadly see who are the most influential executives or firms in Singapore. In addition, Appendix 2 & 3 shows the names of top 10 influential executives and top 10 influential companies in Singapore Interlocking Directorates network. | ||
| + | |||
| + | [[File:Gephi 4.png]] | ||
| + | |||
| + | The full network graph are composed of multiple smaller components. The smallest component is one company linked with one or more executives. On the sample below (Graph 5.2.1), Tong Lee Company Pte Ltd consists of only two executives on its directors boards: Brian Ang and Lawrence Ang. On another example, Graph 5.2.2 below shows CPG Investments Pte. Ltd. which has many executives sitting on its directors board. There is actually no limitation on the number of executives firms can have in their directors boards. It depends on the size of the firms, as well as the structure of their governance. However, in social network concept, firms should take into account that the more executives are connected with a company, the more possibility that the information from the company will be widely distributed. | ||
| + | |||
| + | [[File:Gephi 5.png]] [[File:Gephi 6.png]] | ||
| + | |||
| + | Graph 5.1.3 is a bigger component which has connections of interlocking directorships. Fsl Trust Management Pte. Ltd and First Ship Lease Trust are connected by three executives: Roger Woods, Philip Tan Eng Lay and Timothy James Reid. The three executives hold the roles as the coordinators, tying the relationship between the two firms. It is useful to know the component as component can be used as an effective tool to identify how meaningful are the ties amongst the actors in the interlocking network. In Gephi, I can use the filter to show the component related to a specific actor. For instance, if an investor wants to see the connection of executive Roger Woods, he can enter “Roger Woods” to Gephi Ego Topology Filter, and Gephi will show the network of only Roger Woods, instead of the whole network of Singapore executives. | ||
| + | |||
| + | [[File:Gephi 7.png]] | ||
| + | |||
| + | '''Networks classified by Industry''' | ||
| + | |||
| + | Some prior studies have raised the concern that different industries may have different impacts on the interlocking directorship. Hence, in Gephi, I have made some visualization using different dataset from three different industries. The results will be discussed below. | ||
| + | |||
| + | '''Wholesale & Retail Trade Industry''' | ||
| + | |||
| + | [[File:Table 1.PNG]] | ||
| + | |||
| + | According to industry distribution (Figure 5.3.1), Wholesales and Retail Trade has the highest number of companies involved, almost doubled the following industry - Manufacturing. Because of the high number of companies, the distribution is highly dense to the edge, where the companies has little or no links with one another. Overall, interlocking directorates are being practiced in this sector, and most of the executives who hold more important position than others (being the larger nodes) are quite evenly distributed as the node sizes are not so much differentiated from each other. There are only a few people who has more influence in the network, and are shown as larger blue nodes: David Tan, Siew Tan, James Tan, Lan Sim Lim, Richard Tan, etc. Investors and researchers who are interested in the people involved in Wholesales & Retail Trade Interlocking Directorates network can use Gephi filter to analyze only some specific nodes which relate to their interests. | ||
| + | |||
| + | [[File:Gephi 8.png]] | ||
| + | |||
| + | '''Manufacturing Interlocking Network''' | ||
| + | |||
| + | Being the second largest industry in Singapore, Manufacturing Industry has a lot of interlocking directorates connections. However, unlike the Wholesales and Retail Trade Interlocking Network, Manufacturing has more of the “more important” executives, being shown as a cluster of big nodes in the centre. It is highlighted that the executives in the centre are more actively holding positions in directors boards concurrently in multiple firms, thus controlling more information and more power across the network. As the power is concentrated in the hands of these governing elites, there is higher potential that fraud can happen as well. The hubs (executives who have many connections to multiple firms, or firms that hold connections to more executives), can be an early indication of accounting fraud which may happen in the future, and so these hubs need more attention from the investors, researchers or auditors. | ||
| + | |||
| + | [[File:Gephi 9.png]] | ||
| + | |||
| + | '''Financial & Insurance Industry''' | ||
| + | |||
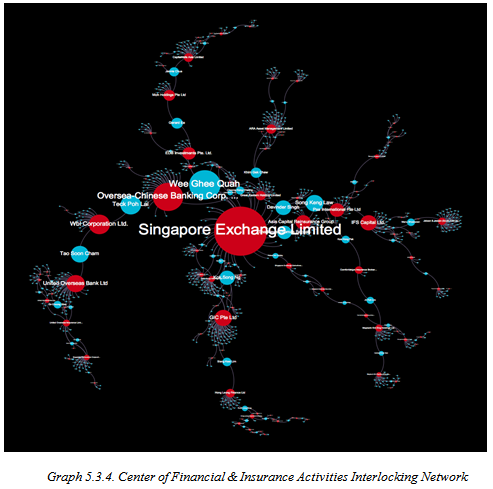
| + | Because Financial Services has always been seen as an important industry, we further analyze the distribution of interlocking directorates in the Financial and Insurance Activities Industry. The pattern of practicing interlocking directorates in the Financial Services is different from those in the previous sectors’: in the Financial and Insurance Activities , there are more firms centered in the distribution, and Singapore Exchange Limited has dominated the information control and influence in the network, being the largest node. In terms of betweenness centrality, SGX has the highest betweenness centrality scores, allowing it to take control of the information mostly in the Financial Industry. | ||
| + | |||
| + | To understand how much important is Singapore Exchange, we used Gephi filter to get only the nodes which are related or can be reached via SGX, and came up with a big component below, showing the central of Financial & Insurance Activities interlocking directorates network. | ||
| + | |||
| + | [[File:Gephi 10.png]] [[File:Gephi 11.png]] | ||
| + | |||
| + | Besides SGX which dominated the industry, there are a few other banks that also have big impacts on other business: Oversea Chinese Banking and United Overseas Bank (UOB), or GIC Pte Ltd, IPS Capital Ltd and Wbl Corporation Ltd. It is interesting to know that by only choosing SGX as the main actor, it is eventually connected to every other actors (firms and executives inclusively) in the center of Financial & Insurance Activities Interlocking Network. There are also people who hold important positions in these large companies, and thus results on them having higher betweenness centrality as well. These people are Wee Ghee Quah, Teck Poh Lai, Tao Soon Cham, Song Keng Lau, Davinder Singh, Kok Song Ng, etc. Thus, by conducting the same experiment on the specific actor of interest, the ties linked to that actor can be filtered out to see how influential that actor is. | ||
| + | |||
| + | Nevertheless, we understand that it might not be completed to just only look at the network industry one by one. Thus we take a step further to discuss the network based on geographic locations of the firms’ offices location. | ||
| + | |||
| + | '''Connections in the same building''' | ||
| + | |||
| + | There has been questions on how business networks are configured in actual space (Carroll & Sapinski, 2011). The geography of corporate networks may greatly influence the cohesiveness of the network, which in turn, can be an indicative cue for possible fraudulent companies. Hence, it is not abnormal that the companies accused of committing frauds to locate near each other. | ||
| + | Below, we have identified the top 7 postal codes which have the highest number of companies residing inside, all of which having 300 companies operating concurrently. Next we will examine the network within each building to see if there is any abnormal patterns in the network. | ||
| + | |||
| + | [[File:Table 2.PNG]] | ||
| + | |||
| + | International Plaza & Ubi Tech park | ||
| + | |||
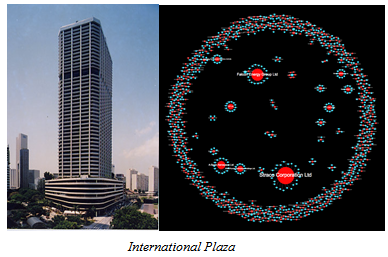
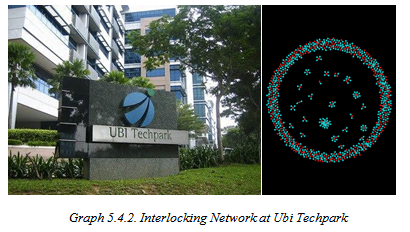
| + | In Singapore, businesses are concentrated in some main buildings and businesses areas. Looking at the distribution of interlocking directorates network in International Plaza and Ubi Techpark, the top most “dense” area, there is actually very little or no linkage between the firms and the executives. The whole network can be broken down to the smallest type of component, and there is little chance that the executives representing the firms in the same building know each other by sitting in the same directors boards. | ||
| + | |||
| + | [[File:Gephi 12.png]] [[File:Gephi 13.png]] | ||
| + | |||
| + | Suntec Tower 2 | ||
| + | |||
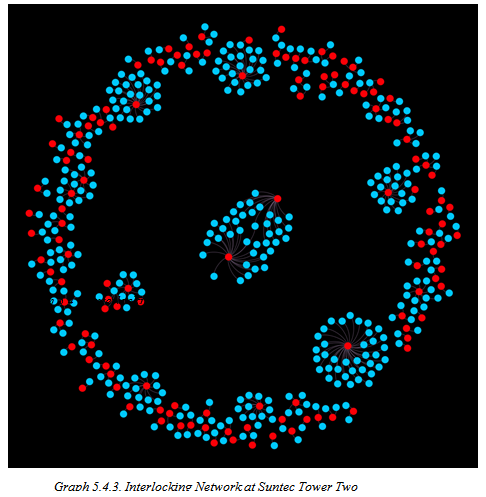
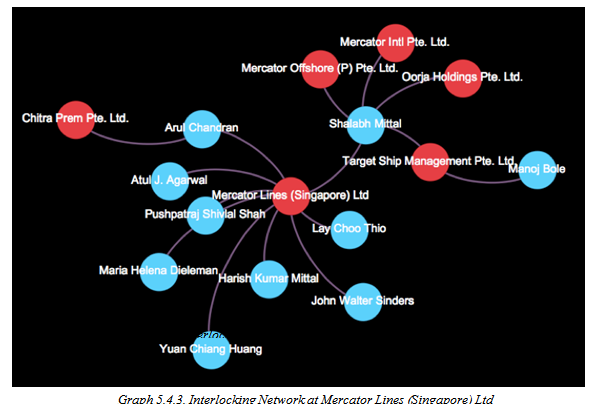
| + | While examining the connections of interlocking directorship in Suntec Tower Two (Graph 5.4.3), I noticed that the firms and executives are not so related in general. However, there is a component that one executives are holding multiple positions in different companies. Therefore, I zoom in to the components to further understand who the executive is and which companies he is operating at. | ||
| + | Graph 5.4.4 shows the details of the component mentioned above. In this case, Arul Chandran holds both position in Mercator Lines (Singapore) Ltd and Chintra Prem Pte. Ltd., where he is the only one executive acting in the firm’s governance. Another executive from Mercator Lines (Singapore) Ltd – Shalabh Mittal, holding executive positions on three other companies on his own: Mercator Offshore (P) Pte. Ltd., Mercator Intl Pte. Ltd., Oorja Holdings Pte. Ltd., and another company which he share the management with one other executive Manoj Bole. Examining these connections set up may shed some lights on the operations of the company. | ||
| + | |||
| + | [[File:Gephi 14.png]] [[File:Gephi 15.png]] | ||
| + | |||
| + | News from newspaper proves that the suspicion may be appropriate. On April 13, 2015 on the news from TradeWinds, Shalabh Mittal, the CEO of Mercator Line (Singapore) Ltd., on behalf of Mercator Lines (Singapore) has announced to seek for a financial advisor because the company is having issues in dry cargo markets. Quoted Shalabh Mittal, Mercator Lines was having a sharp deterioration in the market and this had “led to a reduction in freight rates and further declines in dry bulk asset values, which may impact company’s cash flows, financial position and certain covenants under loan facilities.” Mercator Lines (Singapore) reported a third quarter net loss of close to $7.5million this January (2015), and last year it announced a loss of $3.3million. The reason is said to be due to the collapse in the dry bulk market worldwide, which led to filing for bankruptcy of other Denmark and China shipping companies. It is as well interesting to know that Shalabh Mittal is the son of the promoter , founder and executive chairman Harish Kumar Mittal, who set up the company Mercator Line (Singapore) Ltd. from scratch. The announcement was made only earlier on January this year. Furthermore, according to dnaindia.com, Harish Kumar Mittal and Atul Agarwal (another executive on board) are co-brothers; they respectively married to sisters Archana and Manjuli. The Mittle and Agarwal families hold 40.22% stake in Mercator Ltd. | ||
| + | |||
| + | Therefore, there is potential that the interlocking directorates will be helpful to provide useful insights and raise awareness of where accounting fraud may happen. | ||
| + | |||
| + | '''Limitations''' | ||
| + | |||
| + | Our explorations on using social network analytics to indicate potential accounting fraud has a few limitations. First, we only used the data of Singapore listed companies as the data sample. In the real world, executives may not only sit in the directors board in a specific country, but they may also have different positions in across countries worldwide. This issue causes the visualization to be not so effective in predicting the fraudulent activities that the executives may commit. There were cases in the past that the executive committed fraud in a country and funneled the money in different ways to his businesses in other countries. It is difficult to track the fraud and even after the fraud has been committed, it also takes time and effort in the liquidation process to track and fix the after-fraud consequences. | ||
| + | We think that this may be a useful technology to quickly predict fraud at the early stage, yet it could not be as precise as the traditional financial and auditing methods. However, it is possible that if social network analytics is widely adopted, investors and auditors can keep an eye on the companies they are investing in. However, as supported by the previous history work, we strongly believe that with more careful development, visual data analytics could be an effective technology used to prevent accounting fraud from earlier stage. | ||
| + | |||
| + | '''Future Work''' | ||
| + | |||
| + | In term of predictive performance of this method, it has yet been proven a percent of accuracy of using this method to prevent accounting fraud. There is no historical data to test on. Hence, by comparing the interlocking directorates networks using historical data of the CEOs who already committed fraud, it could provide a percentage of accuracy of this fraud detection model. There would be people who are more likely to commit fraud, as well as there would be industries that are more likely to have fraud scandals. These executives, firms and companies thus need higher attention from investors, auditors, and policy makers. Both financial statement data and non-financial measurements should work together to serve as a red flag to related parties and lead them to ask pointed questions of client management, corroborate and test management’s responses, and if necessary, serve as a tipping point for assigning forensic specialists to the engagement. | ||
| + | Besides, since previous studies show that the economic effect of interlocking directorate network is more pronounced in non-state-owned enterprises (NSOEs) compared to state-owned enterprises (SOEs), more experiments can be conducted in these sectors as well to examine whether the economic effects of interlocking directorate network vary across the state ownership status of firms. | ||
| + | We do hope that future research in this area will provide more insight into the effectiveness use of data analytics to detect accounting fraudulent actions. Further studies in this area, especially regarding board processes and team dynamics, as well as about management control and resource dependency theories, would be useful in furthering our understanding on the importance and effects of interlocking directorates and accounting fraud indication in Singapore. | ||
| + | |||
| + | =<font face="Corbel" color= #8A740C> Spatiality of Interlocking Directorates </font>= | ||
| + | <font size=3px> | ||
| + | |||
| + | '''Introduction''' | ||
| + | |||
| + | As seen in a 2014 article by Gavin Shatkin, Singapore is widely heralded for its urban planning achievements which embody growth and efficiency. Singapore is able to ensure a conducive environment because the government owns nearly 70% of the land and has a legislative provision which allows cheap acquisition of land for development (Ng, 1999, p.17). This control has allowed Singapore to create clearly demarcated zones for different businesses and industries to function and thrive in. As seen in studies by Sorenson (2013) and Zhang et al (2009), geographic factors can affect the formation of networks. This in turn can affect the level of social capital and information transformation within firms. Therefore, our team was interested to find out if these patterns exist in the different districts of Singapore. | ||
| + | |||
| + | '''Methodology''' | ||
| + | |||
| + | The team first located the postal districts which has the highest concentration of Singapore companies. Using JMP distribution function, the team found that the top districts are District 1, 22, 14, 7 and 13 as seen in the chart on the left. Following this, our team attempted to characterize these districts through their geographical location and the industry distribution within each district as seen in the JMP graphs in Appendix 5. | ||
| + | |||
| + | [[File:Table 3.PNG]] | ||
| + | |||
| + | '''Postal Districts Characterization''' | ||
| + | |||
| + | Located in the central-south part of Singapore, District 1 is undoubtly the country’s financial district. As seen in Appendix 5, District 1 contains more than 40% of the country’s financial and insurance firms and also a very high proportion of Singapore’s professional service industry. District 22 is Jurong Industrial estate and contains nearly 20% of all manufacturing firms in Singapore. District 14 is the central East area which consists of many light manufacturing industries. It also contains a large mix of wholesale and construction firms. District 7 and 13 are typical examples of live-work hubs where they contain a low proportion of numerous industries in the area. | ||
| + | |||
| + | '''Observations''' | ||
| + | |||
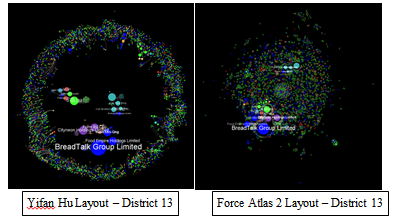
| + | After conducting descriptive analysis on the different districts, our team created Gephi visualizations for the interlocking directorates linkages of each district. As the Gephi layout tutorial states that Force Atlas and Yifan Hu were better at emphasizing complementaries, our team experimented with both of them. Force Atlas is a layout designed by Gephi developers and we observed that it pushes high betweeness centrality nodes to the edges. In contrast, Yifan Hu centralizes the high betweeness centrality nodes and pushes smaller nodes to the edges. These observations can be seen in the visualizations below. | ||
| + | |||
| + | [[File:Gephi 16.png]] | ||
| + | |||
| + | As Yifan Hu’s visualization were more intuitive and could better portray our team needs, we chose to conduct our observations and analysis with this layout. | ||
| + | |||
| + | '''Inter-District Comparisons''' | ||
| + | |||
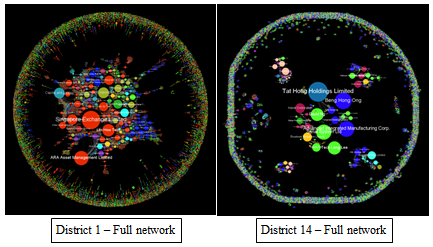
| + | We first attempted to observe inter-district patterns of interlocking directorates. By comparing all 5 districts, the team noticed that District 1 and 22 were dominated by one principal linkage whilst the other 3 districts had several moderate linkages. Using Gephi’s “Giant Component” filter, we observed that the dominant linkages of District 1 and 22 accounted for 13.71% and 16.41% of all their nodes respectively. In contrast, the largest linkage of the other 3 districts accounted less than 2% of their respective district’s nodes. All visualizations can be seen in Appendix 6. | ||
| + | |||
| + | [[File:Gephi 17.png]] | ||
| + | |||
| + | This is interesting to note since this pattern is incongruent with Sorenson’s theory which states that firms in a smaller geographic area enjoys stronger interlocking directorates. One plausible reason for our observed pattern is because both District 1 and 22 contains large numbers of government linked companies and public service firms. This is most obviously seen in District 1, where SGX and its executives are central to the linkage. As government linked companies often invite executives from other GLCs to join them on their board, our observed pattern is not entirely unexpected. Another possible reason for this observed pattern is that both District 1 and 22 are zones created specially for their respective industries. As mportant venues such as the Parliament House and courts and located there, financial and professional firms will find it more convenient to locate themselves there. Similary, large areas in District 22 far from residential areas, are specially allocated to heavy manufacturing firms so that disturbance is kept to the minimal. In contrast, land in District 14, 7 and 13 are predominantly allocated for light industries. As these firms do not have very stringent requirements to fulfill like heavy manufacturing firms, concentrated clusters do not form here as any firm could establish themselves there. | ||
| + | |||
| + | '''Intra-District Comparisons''' | ||
| + | |||
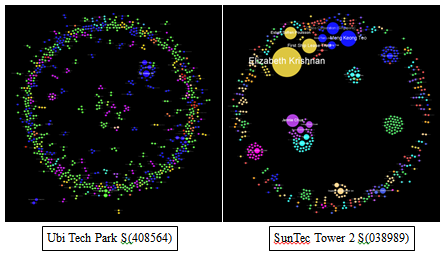
| + | Our team also conducted intra-district observations to gain a fuller picture of interlocking directorates of the areas. Specifically, we created visualizations of the top 3 postal codes of each district to better understand their relationships. As parent and subsidiary companies can be expected to be near each other, the team assumed that we will find multiple linkages in this analysis. Therefore, we were surprised to find that most of the 15 postal codes we looked at were similar to the visualizations below; where only a handful of buildings had interlocking directorates. The full comparison can be found in Appendix 7. | ||
| + | |||
| + | [[File:Gephi 18.png]] | ||
| + | |||
| + | '''Discussion''' | ||
| + | |||
| + | From the above observations, the team observes that industries in Singapore tend to exist in the same geographical area. Potential reasons for this occurrence could be linked to the clear demarcation of zones by Singapore planners and the minimalization of costs of acquiring complementary resources. We also observe that unlike Sonderson’s theory, large dominant linkages are found in the larger districts instead of the smaler ones. This can also be attributed to the allocation of space by Singapore planners and also that government linked companies dominate both District 1 and 22. We also observed that there are few interlocking directorates within buildings housing different companies. Hence, we infer that social capital flows are limited for non-government linked companies, as very few interlocking directorates exist between them. As Tian et al. observed, interlocking directorates is a major source of social capital. In addition, an increase in social capital has been shown to lead to an increase in innovation of firms (Dominicis et al., 2013. Since Singapore has been trying to foster innovation amongst its firms, urban planners could attempt to introduce measures which increase interlocking directorates between firms of the same geographic area. One step in the right direction is the plan for Punggol Creative Cluster, where plans show that future firms will enjoy links with a tertiary institution located beside it. This tertiary institution can then function as a channel for firms to interact with each other. | ||
| + | |||
| + | '''Limitations and Future Work''' | ||
| + | |||
| + | While interlocking directorates are important sources of social capital which increases knowledge spillovers, there are countless other ways for knowledge to be spread. One method could be partnerships where companies build on each other’s products to achieve innovation. Even simple interactions between employees on a day-to-day basis could encourage knowledge spillovers and these cannot be captured in our model. | ||
| + | These limitations show that there is much ground to cover for spatial analysis of interlocking directorates in Singapore. Future projects could aim to map out dominant services within each district to understand which firms drive the district’s growth. Future projects could also look at the tangible effect of interlocking directorates and innovation, by measuring the relationships of the number of interlocks and the number of patents a firm has produced. | ||
Latest revision as of 22:04, 24 April 2015
| Home | Project Methodology | Findings & Insights | Project Management | Project Documentation | Learning Outcomes |
Duality of Interlocking Directorates
Visualization process:
We used Gephi, a data visual analytics tool, to visualize the interlocking directorates network. Gephi is also an open source interactive network exploration visualization. We also did the experiments on another visualization software - NodeXL, yet because Gephi proved to be stronger in processing large data, eventually I mostly use Gephi to generate the graphs.
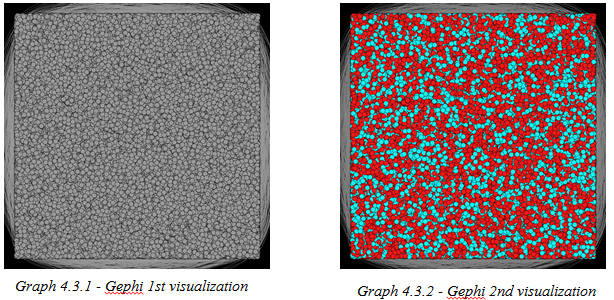
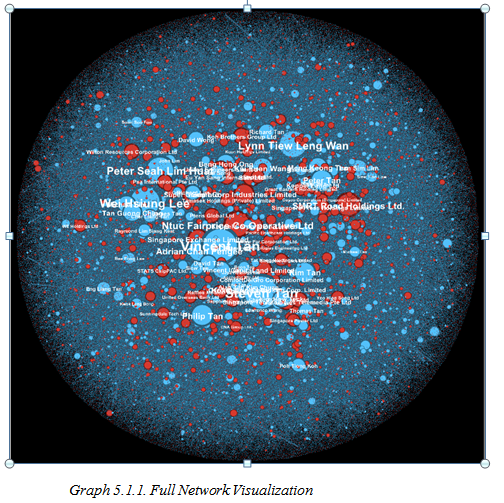
The visualization process in Gephi requires a lot of trials and errors in adjusting the properties to come up with meaningful graphs, which are useful for fraud risk assessment analysis. The first graph we generated was a group of gray nodes which cannot express any insights at all (Graph 4.3.1 - Gephi 1st visualization). Because the network contains of directors and companies, which should be displayed differently in the network, we separate them by color coding: the nodes in red represent the company, and those in blue represent the executives (Graph 4.3.2 - Gephi 2nd visualization).
After color coding the nodes, it was still difficult to see the connections between them, so we managed to rank the nodes according to its betweenness centrality, so the nodes with higher betweenness centrality scores will be displayed as bigger than those with lower scores. I also carefully considered different layout and display options to come up with the final layouts, which will be discussed in the next section.
Results:
Full Network Visualization:
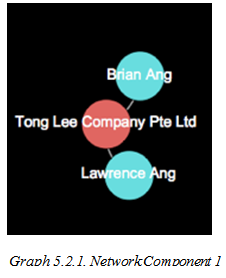
Graph 5.1.1. represents the whole Singapore interlocking directorates network. The red color nodes represent the companies, and blue color represent the directors. The sizes of the nodes are ranked according to betweenness centrality; the bigger the node is, the higher betweenness centrality score it has. A high betweenness centrality might suggest that the individual is connecting various different parts of the network together; hence, the big nodes are expected to hold more control and influence over the network. Nodes around the edge of the network are typically have a low betweenness centrality. This whole network visualization allows us to broadly see who are the most influential executives or firms in Singapore. In addition, Appendix 2 & 3 shows the names of top 10 influential executives and top 10 influential companies in Singapore Interlocking Directorates network.
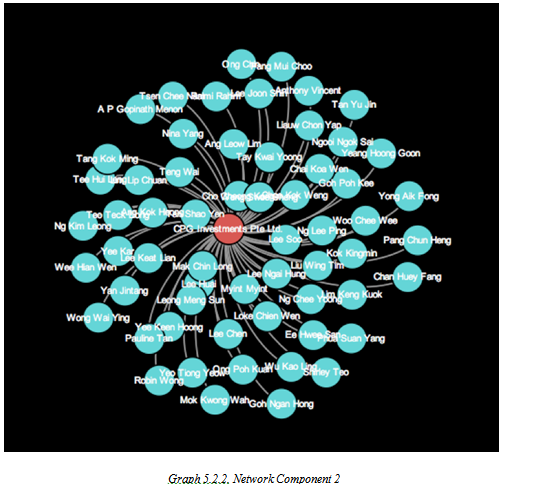
The full network graph are composed of multiple smaller components. The smallest component is one company linked with one or more executives. On the sample below (Graph 5.2.1), Tong Lee Company Pte Ltd consists of only two executives on its directors boards: Brian Ang and Lawrence Ang. On another example, Graph 5.2.2 below shows CPG Investments Pte. Ltd. which has many executives sitting on its directors board. There is actually no limitation on the number of executives firms can have in their directors boards. It depends on the size of the firms, as well as the structure of their governance. However, in social network concept, firms should take into account that the more executives are connected with a company, the more possibility that the information from the company will be widely distributed.
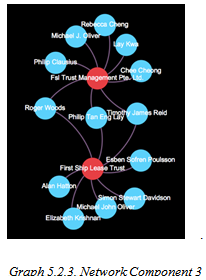
Graph 5.1.3 is a bigger component which has connections of interlocking directorships. Fsl Trust Management Pte. Ltd and First Ship Lease Trust are connected by three executives: Roger Woods, Philip Tan Eng Lay and Timothy James Reid. The three executives hold the roles as the coordinators, tying the relationship between the two firms. It is useful to know the component as component can be used as an effective tool to identify how meaningful are the ties amongst the actors in the interlocking network. In Gephi, I can use the filter to show the component related to a specific actor. For instance, if an investor wants to see the connection of executive Roger Woods, he can enter “Roger Woods” to Gephi Ego Topology Filter, and Gephi will show the network of only Roger Woods, instead of the whole network of Singapore executives.
Networks classified by Industry
Some prior studies have raised the concern that different industries may have different impacts on the interlocking directorship. Hence, in Gephi, I have made some visualization using different dataset from three different industries. The results will be discussed below.
Wholesale & Retail Trade Industry
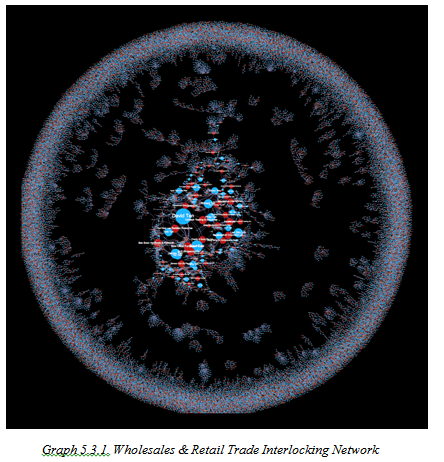
According to industry distribution (Figure 5.3.1), Wholesales and Retail Trade has the highest number of companies involved, almost doubled the following industry - Manufacturing. Because of the high number of companies, the distribution is highly dense to the edge, where the companies has little or no links with one another. Overall, interlocking directorates are being practiced in this sector, and most of the executives who hold more important position than others (being the larger nodes) are quite evenly distributed as the node sizes are not so much differentiated from each other. There are only a few people who has more influence in the network, and are shown as larger blue nodes: David Tan, Siew Tan, James Tan, Lan Sim Lim, Richard Tan, etc. Investors and researchers who are interested in the people involved in Wholesales & Retail Trade Interlocking Directorates network can use Gephi filter to analyze only some specific nodes which relate to their interests.
Manufacturing Interlocking Network
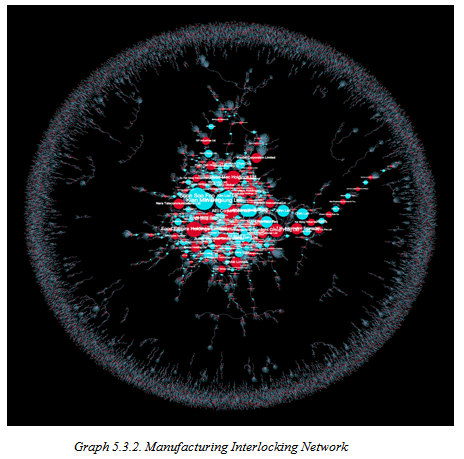
Being the second largest industry in Singapore, Manufacturing Industry has a lot of interlocking directorates connections. However, unlike the Wholesales and Retail Trade Interlocking Network, Manufacturing has more of the “more important” executives, being shown as a cluster of big nodes in the centre. It is highlighted that the executives in the centre are more actively holding positions in directors boards concurrently in multiple firms, thus controlling more information and more power across the network. As the power is concentrated in the hands of these governing elites, there is higher potential that fraud can happen as well. The hubs (executives who have many connections to multiple firms, or firms that hold connections to more executives), can be an early indication of accounting fraud which may happen in the future, and so these hubs need more attention from the investors, researchers or auditors.
Financial & Insurance Industry
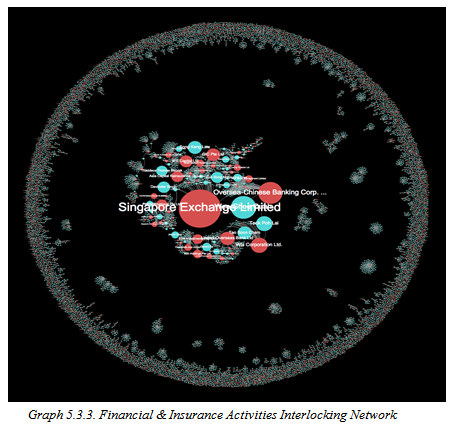
Because Financial Services has always been seen as an important industry, we further analyze the distribution of interlocking directorates in the Financial and Insurance Activities Industry. The pattern of practicing interlocking directorates in the Financial Services is different from those in the previous sectors’: in the Financial and Insurance Activities , there are more firms centered in the distribution, and Singapore Exchange Limited has dominated the information control and influence in the network, being the largest node. In terms of betweenness centrality, SGX has the highest betweenness centrality scores, allowing it to take control of the information mostly in the Financial Industry.
To understand how much important is Singapore Exchange, we used Gephi filter to get only the nodes which are related or can be reached via SGX, and came up with a big component below, showing the central of Financial & Insurance Activities interlocking directorates network.
Besides SGX which dominated the industry, there are a few other banks that also have big impacts on other business: Oversea Chinese Banking and United Overseas Bank (UOB), or GIC Pte Ltd, IPS Capital Ltd and Wbl Corporation Ltd. It is interesting to know that by only choosing SGX as the main actor, it is eventually connected to every other actors (firms and executives inclusively) in the center of Financial & Insurance Activities Interlocking Network. There are also people who hold important positions in these large companies, and thus results on them having higher betweenness centrality as well. These people are Wee Ghee Quah, Teck Poh Lai, Tao Soon Cham, Song Keng Lau, Davinder Singh, Kok Song Ng, etc. Thus, by conducting the same experiment on the specific actor of interest, the ties linked to that actor can be filtered out to see how influential that actor is.
Nevertheless, we understand that it might not be completed to just only look at the network industry one by one. Thus we take a step further to discuss the network based on geographic locations of the firms’ offices location.
Connections in the same building
There has been questions on how business networks are configured in actual space (Carroll & Sapinski, 2011). The geography of corporate networks may greatly influence the cohesiveness of the network, which in turn, can be an indicative cue for possible fraudulent companies. Hence, it is not abnormal that the companies accused of committing frauds to locate near each other. Below, we have identified the top 7 postal codes which have the highest number of companies residing inside, all of which having 300 companies operating concurrently. Next we will examine the network within each building to see if there is any abnormal patterns in the network.
International Plaza & Ubi Tech park
In Singapore, businesses are concentrated in some main buildings and businesses areas. Looking at the distribution of interlocking directorates network in International Plaza and Ubi Techpark, the top most “dense” area, there is actually very little or no linkage between the firms and the executives. The whole network can be broken down to the smallest type of component, and there is little chance that the executives representing the firms in the same building know each other by sitting in the same directors boards.
Suntec Tower 2
While examining the connections of interlocking directorship in Suntec Tower Two (Graph 5.4.3), I noticed that the firms and executives are not so related in general. However, there is a component that one executives are holding multiple positions in different companies. Therefore, I zoom in to the components to further understand who the executive is and which companies he is operating at. Graph 5.4.4 shows the details of the component mentioned above. In this case, Arul Chandran holds both position in Mercator Lines (Singapore) Ltd and Chintra Prem Pte. Ltd., where he is the only one executive acting in the firm’s governance. Another executive from Mercator Lines (Singapore) Ltd – Shalabh Mittal, holding executive positions on three other companies on his own: Mercator Offshore (P) Pte. Ltd., Mercator Intl Pte. Ltd., Oorja Holdings Pte. Ltd., and another company which he share the management with one other executive Manoj Bole. Examining these connections set up may shed some lights on the operations of the company.
News from newspaper proves that the suspicion may be appropriate. On April 13, 2015 on the news from TradeWinds, Shalabh Mittal, the CEO of Mercator Line (Singapore) Ltd., on behalf of Mercator Lines (Singapore) has announced to seek for a financial advisor because the company is having issues in dry cargo markets. Quoted Shalabh Mittal, Mercator Lines was having a sharp deterioration in the market and this had “led to a reduction in freight rates and further declines in dry bulk asset values, which may impact company’s cash flows, financial position and certain covenants under loan facilities.” Mercator Lines (Singapore) reported a third quarter net loss of close to $7.5million this January (2015), and last year it announced a loss of $3.3million. The reason is said to be due to the collapse in the dry bulk market worldwide, which led to filing for bankruptcy of other Denmark and China shipping companies. It is as well interesting to know that Shalabh Mittal is the son of the promoter , founder and executive chairman Harish Kumar Mittal, who set up the company Mercator Line (Singapore) Ltd. from scratch. The announcement was made only earlier on January this year. Furthermore, according to dnaindia.com, Harish Kumar Mittal and Atul Agarwal (another executive on board) are co-brothers; they respectively married to sisters Archana and Manjuli. The Mittle and Agarwal families hold 40.22% stake in Mercator Ltd.
Therefore, there is potential that the interlocking directorates will be helpful to provide useful insights and raise awareness of where accounting fraud may happen.
Limitations
Our explorations on using social network analytics to indicate potential accounting fraud has a few limitations. First, we only used the data of Singapore listed companies as the data sample. In the real world, executives may not only sit in the directors board in a specific country, but they may also have different positions in across countries worldwide. This issue causes the visualization to be not so effective in predicting the fraudulent activities that the executives may commit. There were cases in the past that the executive committed fraud in a country and funneled the money in different ways to his businesses in other countries. It is difficult to track the fraud and even after the fraud has been committed, it also takes time and effort in the liquidation process to track and fix the after-fraud consequences. We think that this may be a useful technology to quickly predict fraud at the early stage, yet it could not be as precise as the traditional financial and auditing methods. However, it is possible that if social network analytics is widely adopted, investors and auditors can keep an eye on the companies they are investing in. However, as supported by the previous history work, we strongly believe that with more careful development, visual data analytics could be an effective technology used to prevent accounting fraud from earlier stage.
Future Work
In term of predictive performance of this method, it has yet been proven a percent of accuracy of using this method to prevent accounting fraud. There is no historical data to test on. Hence, by comparing the interlocking directorates networks using historical data of the CEOs who already committed fraud, it could provide a percentage of accuracy of this fraud detection model. There would be people who are more likely to commit fraud, as well as there would be industries that are more likely to have fraud scandals. These executives, firms and companies thus need higher attention from investors, auditors, and policy makers. Both financial statement data and non-financial measurements should work together to serve as a red flag to related parties and lead them to ask pointed questions of client management, corroborate and test management’s responses, and if necessary, serve as a tipping point for assigning forensic specialists to the engagement. Besides, since previous studies show that the economic effect of interlocking directorate network is more pronounced in non-state-owned enterprises (NSOEs) compared to state-owned enterprises (SOEs), more experiments can be conducted in these sectors as well to examine whether the economic effects of interlocking directorate network vary across the state ownership status of firms. We do hope that future research in this area will provide more insight into the effectiveness use of data analytics to detect accounting fraudulent actions. Further studies in this area, especially regarding board processes and team dynamics, as well as about management control and resource dependency theories, would be useful in furthering our understanding on the importance and effects of interlocking directorates and accounting fraud indication in Singapore.
Spatiality of Interlocking Directorates
Introduction
As seen in a 2014 article by Gavin Shatkin, Singapore is widely heralded for its urban planning achievements which embody growth and efficiency. Singapore is able to ensure a conducive environment because the government owns nearly 70% of the land and has a legislative provision which allows cheap acquisition of land for development (Ng, 1999, p.17). This control has allowed Singapore to create clearly demarcated zones for different businesses and industries to function and thrive in. As seen in studies by Sorenson (2013) and Zhang et al (2009), geographic factors can affect the formation of networks. This in turn can affect the level of social capital and information transformation within firms. Therefore, our team was interested to find out if these patterns exist in the different districts of Singapore.
Methodology
The team first located the postal districts which has the highest concentration of Singapore companies. Using JMP distribution function, the team found that the top districts are District 1, 22, 14, 7 and 13 as seen in the chart on the left. Following this, our team attempted to characterize these districts through their geographical location and the industry distribution within each district as seen in the JMP graphs in Appendix 5.
Postal Districts Characterization
Located in the central-south part of Singapore, District 1 is undoubtly the country’s financial district. As seen in Appendix 5, District 1 contains more than 40% of the country’s financial and insurance firms and also a very high proportion of Singapore’s professional service industry. District 22 is Jurong Industrial estate and contains nearly 20% of all manufacturing firms in Singapore. District 14 is the central East area which consists of many light manufacturing industries. It also contains a large mix of wholesale and construction firms. District 7 and 13 are typical examples of live-work hubs where they contain a low proportion of numerous industries in the area.
Observations
After conducting descriptive analysis on the different districts, our team created Gephi visualizations for the interlocking directorates linkages of each district. As the Gephi layout tutorial states that Force Atlas and Yifan Hu were better at emphasizing complementaries, our team experimented with both of them. Force Atlas is a layout designed by Gephi developers and we observed that it pushes high betweeness centrality nodes to the edges. In contrast, Yifan Hu centralizes the high betweeness centrality nodes and pushes smaller nodes to the edges. These observations can be seen in the visualizations below.
As Yifan Hu’s visualization were more intuitive and could better portray our team needs, we chose to conduct our observations and analysis with this layout.
Inter-District Comparisons
We first attempted to observe inter-district patterns of interlocking directorates. By comparing all 5 districts, the team noticed that District 1 and 22 were dominated by one principal linkage whilst the other 3 districts had several moderate linkages. Using Gephi’s “Giant Component” filter, we observed that the dominant linkages of District 1 and 22 accounted for 13.71% and 16.41% of all their nodes respectively. In contrast, the largest linkage of the other 3 districts accounted less than 2% of their respective district’s nodes. All visualizations can be seen in Appendix 6.
This is interesting to note since this pattern is incongruent with Sorenson’s theory which states that firms in a smaller geographic area enjoys stronger interlocking directorates. One plausible reason for our observed pattern is because both District 1 and 22 contains large numbers of government linked companies and public service firms. This is most obviously seen in District 1, where SGX and its executives are central to the linkage. As government linked companies often invite executives from other GLCs to join them on their board, our observed pattern is not entirely unexpected. Another possible reason for this observed pattern is that both District 1 and 22 are zones created specially for their respective industries. As mportant venues such as the Parliament House and courts and located there, financial and professional firms will find it more convenient to locate themselves there. Similary, large areas in District 22 far from residential areas, are specially allocated to heavy manufacturing firms so that disturbance is kept to the minimal. In contrast, land in District 14, 7 and 13 are predominantly allocated for light industries. As these firms do not have very stringent requirements to fulfill like heavy manufacturing firms, concentrated clusters do not form here as any firm could establish themselves there.
Intra-District Comparisons
Our team also conducted intra-district observations to gain a fuller picture of interlocking directorates of the areas. Specifically, we created visualizations of the top 3 postal codes of each district to better understand their relationships. As parent and subsidiary companies can be expected to be near each other, the team assumed that we will find multiple linkages in this analysis. Therefore, we were surprised to find that most of the 15 postal codes we looked at were similar to the visualizations below; where only a handful of buildings had interlocking directorates. The full comparison can be found in Appendix 7.
Discussion
From the above observations, the team observes that industries in Singapore tend to exist in the same geographical area. Potential reasons for this occurrence could be linked to the clear demarcation of zones by Singapore planners and the minimalization of costs of acquiring complementary resources. We also observe that unlike Sonderson’s theory, large dominant linkages are found in the larger districts instead of the smaler ones. This can also be attributed to the allocation of space by Singapore planners and also that government linked companies dominate both District 1 and 22. We also observed that there are few interlocking directorates within buildings housing different companies. Hence, we infer that social capital flows are limited for non-government linked companies, as very few interlocking directorates exist between them. As Tian et al. observed, interlocking directorates is a major source of social capital. In addition, an increase in social capital has been shown to lead to an increase in innovation of firms (Dominicis et al., 2013. Since Singapore has been trying to foster innovation amongst its firms, urban planners could attempt to introduce measures which increase interlocking directorates between firms of the same geographic area. One step in the right direction is the plan for Punggol Creative Cluster, where plans show that future firms will enjoy links with a tertiary institution located beside it. This tertiary institution can then function as a channel for firms to interact with each other.
Limitations and Future Work
While interlocking directorates are important sources of social capital which increases knowledge spillovers, there are countless other ways for knowledge to be spread. One method could be partnerships where companies build on each other’s products to achieve innovation. Even simple interactions between employees on a day-to-day basis could encourage knowledge spillovers and these cannot be captured in our model. These limitations show that there is much ground to cover for spatial analysis of interlocking directorates in Singapore. Future projects could aim to map out dominant services within each district to understand which firms drive the district’s growth. Future projects could also look at the tangible effect of interlocking directorates and innovation, by measuring the relationships of the number of interlocks and the number of patents a firm has produced.
