Network Analysis of Interlocking Directorates
| Home | Project Methodology | Findings & Insights | Project Management | Project Documentation | Learning Outcomes |
Our Project
Interlocking directorates has been an interesting topic that captured much attention from the researchers and the public for more than a century. Many methods have been developed to analyze this two-mode network, revealing its practical application in diverse fields of study.
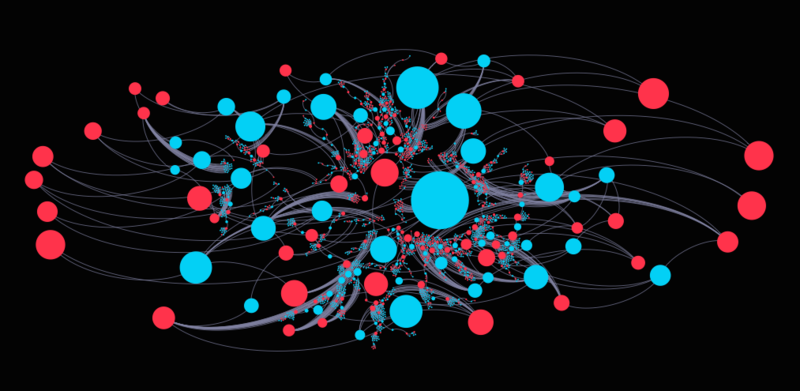
In this study, we study the data from Singapore interlocking directorates network, visualize it using visual analytics tools, determine its patterns and propose some of the applications using the visualization and analysis results. Our proposed applications includes using interlocking directorates network to early detect the commitment of accounting fraud, as well as to aid the Singapore authorities in urban development planning.
This is the integration from the knowledge we have acquired from accounting, information systems, business administration and social sciences courses, which we hope the idea would be able to be applied in real life.
Our Motivation
Looking at both the advantages and disadvantages of interlocking directorates networks, we were motivated by two ideas:
- a non-financial measured method can be effectively used to assess fraud risk
- second – urban planning may revolve around clustering concept that can be effectively displayed by the visualization of the relations between firms and social capital.
By examining the interlocking directorate network and indicating the importance of a firm or director’s position in the interlocking network, we hope to be able to set focus on the individuals who might possibly have deceptive actions and connections. The executives, who have set up many connections in multiple firms at the same time, are subjected to “potentially” facilitate fraudulent activities among these companies. Because these interlocking executives can control a big deal of information, they can make use of it to gain personal benefit either for themselves or for the companies they are governing. Moreover, as interlocking directorates is a major source of social capital, examining these patterns can contribute to research in urban planning for Singapore.
Project Scope
In this study, we used a Singapore sample of companies and directors that contain 50334 listed companies and 82728 directors who hold positions in directors’ boards of these companies. After gathering the sample, we used Gephi, a visual analytics software tool, to visualize the interlocking directorates networks and study the patterns of the interlocking relations. We examined the linkages between the directors and the companies, and also took into accounts the effects of other attributes, such as industry classification and the geographic position of the organizations involved. Key features of our project includes:
- Visualization of the network of interlocking directorates
- Analyzing patterns of interlocking directorates network to predict accounting fraud
- Using interlocking directorates network to aid Singapore urban development planning
Important Updates
Our final presentation slides has been uploaded. Please visit Project Documentation to download.
Stakeholders
Team Members
LE Hoang Trinh
ZHENG Tianwei
Supervisors
Prof. KAM Tin Seong
Associate Professor of Information Systems
Senior Advisor, SIS Programmes in Analytics
