Difference between revisions of "Uncovering Market-Insights for Charles & Keith: Analysis"

From Analytics Practicum
Jump to navigation Jump to search
(Created page with "<!--Banner--> {|style="background-color:#FFFFFF; color:#24c7b1; padding: 6px 0 0 0;" width="100%" cellspacing="0" cellpadding="0" valign="top" border="0" | | style="padding:0...")
 
 
(16 intermediate revisions by 3 users not shown)
Line 1: Line 1:
 +
<div style=background:#B1B4C3 border:#B1B4C3>
 +
[[Image:ANALYSIS.jpg|800px|center]]
 +
</div>
 +
 
<!--Banner-->
 
<!--Banner-->
 
{|style="background-color:#FFFFFF; color:#24c7b1; padding: 6px 0 0 0;" width="100%" cellspacing="0" cellpadding="0" valign="top" border="0"  |
 
{|style="background-color:#FFFFFF; color:#24c7b1; padding: 6px 0 0 0;" width="100%" cellspacing="0" cellpadding="0" valign="top" border="0"  |
Line 5: Line 9:
 
| style="border-bottom:3px solid #35383c; background:none;" width="1%" | &nbsp;
 
| style="border-bottom:3px solid #35383c; background:none;" width="1%" | &nbsp;
 
| style="padding:0.3em; font-size:100%; background-color:#FFFFFF;  border-bottom:3px solid #35383c; text-align:center; color:#828282" width="11%" | [[Uncovering Market-Insights for Charles & Keith: Overview | <font face = "Trebuchet MS" color="#000000" size=2><b>OVERVIEW</b></font>]]
 
| style="padding:0.3em; font-size:100%; background-color:#FFFFFF;  border-bottom:3px solid #35383c; text-align:center; color:#828282" width="11%" | [[Uncovering Market-Insights for Charles & Keith: Overview | <font face = "Trebuchet MS" color="#000000" size=2><b>OVERVIEW</b></font>]]
 +
 +
| style="border-bottom:3px solid #35383c; background:none;" width="1%" | &nbsp;
 +
| style="padding:0.3em; font-size:100%; background-color:#FFFFFF;  border-bottom:3px solid #35383c; text-align:center; color:#828282" width="11%" | [[Uncovering Market-Insights for Charles & Keith: Data Preparation | <font face = "Trebuchet MS" color="#000000" size=2><b>DATA PREPARATION</b></font>]]
  
 
| style="border-bottom:3px solid #35383c; background:none;" width="1%" | &nbsp;
 
| style="border-bottom:3px solid #35383c; background:none;" width="1%" | &nbsp;
Line 17: Line 24:
 
|}
 
|}
  
 +
''Due to the confidentiality of the data provided by our sponsor, we would be only showing the methods of analysis without the results. For authorised stakeholders, please refer to our report for more in-depth analysis with charts and descriptions.''
  
<div style="border-style: solid solid none; border-color: #35383c; border-width: 1px 1px; padding: 5px; font-size: 120%; font-weight: bold; background-color: #{{LibreOfficeColor2}}; color: #{{LibreOfficeColor3}}; border-radius: 3px 3px 0 0;">Data Compilation</div>
 
<div style="border: 1px solid #35383c; padding: 15px 15px 20px; border-radius: 0 0 3px 3px;">
 
We have identified the following sets of data to be useful in understanding C&K’s local market in China:
 
  
*Demographic
+
<center>
*Average age of country/region
+
{| style="background-color:#ffffff ; margin: 3px 11px 3px 11px;" width="80%"|
*Income
+
| style="font-family:Trebuchet MS; font-size:11px; text-align: center; border-top:solid #f5f5f5; background-color: #fff" width="200px" |
*% of Female by Age Category
+
[[Uncovering Market-Insights for Charles & Keith: Analysis|<font color="#3c3c3c"><strong>TOOLS USED</strong></font>]]
*Population Size
 
*Economic
 
*GDP
 
*GDP per capita
 
  
We will be obtaining these data sets for all the cities where C&K have a foothold in. These data will be extracted from China Statistical Yearbook Database and China Knowledge
+
| style="font-family:Trebuchet MS; font-size:11px; text-align: center; border:solid 1px #f5f5f5; background-color: #f5f5f5" width="200px" | 
 +
[[Uncovering Market-Insights for Charles & Keith: EDA 1|<font color="#3c3c3c"><strong>EDA PHASE 1 </strong></font>]]
  
</div>
+
| style="font-family:Trebuchet MS; font-size:11px; text-align: center; border:solid 1px #f5f5f5; background-color: #f5f5f5" width="200px" | 
 +
[[Uncovering Market-Insights for Charles & Keith: EDA 2|<font color="#3c3c3c"><strong>EDA PHASE 2</strong></font>]]
  
 +
| style="font-family:Trebuchet MS; font-size:11px; text-align: center; border:solid 1px #f5f5f5; background-color: #f5f5f5" width="200px" | 
 +
[[Uncovering Market-Insights for Charles & Keith: K-Means Clustering|<font color="#3c3c3c"><strong>CLUSTERING</strong></font>]]
  
<div style="border-style: solid solid none; border-color: #35383c; border-width: 1px 1px; padding: 5px; font-size: 120%; font-weight: bold; background-color: #{{LibreOfficeColor2}}; color: #{{LibreOfficeColor3}}; border-radius: 3px 3px 0 0;">Data Preparation</div>
+
| style="font-family:Trebuchet MS; font-size:11px; text-align: center; border:solid 1px #f5f5f5; background-color: #f5f5f5" width="200px" | 
<div style="border: 1px solid #35383c; padding: 15px 15px 20px; border-radius: 0 0 3px 3px;">
+
[[Uncovering Market-Insights for Charles & Keith: MBA|<font color="#3c3c3c"><strong>MBA</strong></font>]]
Data preprocessing is required to allow insights and knowledge discovery accurately. Data preparation operations such as reduction in number of attributes, outlier detection and discretization are performed to significantly increases the model's’ accuracy that we will be using for analysis.
+
|}
 +
</center>
  
*<u>Dimensionality Reduction</u><br>
+
[[Image:AYEToolsUsed.jpg|900px|center|AYE Tools Used]]
Firstly, we will understand the dataset provided to us. As the dataset provided to us will be of the store transactions in C&K’s China market, it is likely that the fields in the dataset would be in Mandarin, hence we will first have to translate those fields into English before we proceed. Thereafter, we will perform dimensionality reduction by keeping the data fields or attributes that are relevant and insightful towards our analysis and eliminate those that are not useful and unnecessary. <br>
+
[[Image:AYEToolsDescription.png|center|AYE Tools Description]]
 
 
*<u>Filling and Handling</u><br>
 
We will also eliminate the missing data before conducting our analysis. If necessary, these missing values should be filled in using an appropriate approach. Outliers and inaccurate values should be handled and removed from the dataset as well. <br>


*<u>Transformation</u><br>
 
Transformation of the attributes’ values, such as log, may be required if the provided data range are significantly too wide apart or no obvious trends or clusters are being identified. <br>


*<u>Discretization/ Binning</u><br>
 
Continuous attributes should be encoded by discretizing the original values into a small number of value ranges as they provides more meaning to the analysis or bins. The main variables that we are focusing on is the locations, age and RFM categorisation. 


After which, we will categorize the dataset based on the store location where the transactions were made. We will classify the stores based on the China City Tier System, based on this classification method  i.e. Beijing will be classified as a Tier 1 City and all the stores located in the Tier 1 cities would be grouped together. As a result of this classification, we can obtain the various Tiered City Clusters.


Our group believes that this method of classification is a very robust way of grouping C&K’s stores in China as it takes into account the city’s population size, Gross Domestic Product (GDP), Average economic growth, connectivity as a transpiration hub as well as the city’s historical and cultural significance. Furthermore, based on the theories of Consumer Behaviour, customer buying preferences differs based on factors such as level of disposable income, lifestyles and economic environment which is largely characterised by which tier of city one lives in. For example, the buying attitudes of a consumer in an urban metropolis may be different from that of a consumer in a provincial capital. (Assumption: Customer that purchased from a store in Beijing is likely to live and work in Beijing) Hence, by slicing up the data into specific local categories will help provide our group a better understanding of consumer behaviour and trends.


Following, we will bin the data into different categories. Based on the product category list extracted from C&K’s e-commerce site, we will bin the different SKU’s into their respective product categories. Furthermore, based on the interquartile range of product prices of the different product categories, we will bin the products based on their price range.  


</div>


<div style="border-style: solid solid none; border-color: #35383c; border-width: 1px 1px; padding: 5px; font-size: 120%; font-weight: bold; background-color: #{{LibreOfficeColor2}}; color: #{{LibreOfficeColor3}}; border-radius: 3px 3px 0 0;">Data Analysis</div>
 
<div style="border: 1px solid #35383c; padding: 15px 15px 20px; border-radius: 0 0 3px 3px;">
 
<u>Market Basket Analysis (MBA)</u><br>
 
It is a collection of undirected data mining methods for discovering customer purchasing patterns by finding associations between different items in customers’ shopping carts. This project will focus on the Apriori Algorithm as a means to identify the actionable rules present in the in-store transaction data provided by C&K.
 
 
MBA would be conducted on different data levels in attempts to discover different customer purchasing patterns. The different levels this project hopes to explore are as follows:


*Product Category
 
*Tiers of City
 
*Product Materials
 
*Product Price Range


</div>
 

Latest revision as of 18:53, 17 April 2016

ANALYSIS.jpg
HOME   OVERVIEW   DATA PREPARATION   ANALYSIS   PROJECT MANAGEMENT   DOCUMENTATION

Due to the confidentiality of the data provided by our sponsor, we would be only showing the methods of analysis without the results. For authorised stakeholders, please refer to our report for more in-depth analysis with charts and descriptions.


TOOLS USED

EDA PHASE 1

EDA PHASE 2

CLUSTERING

MBA

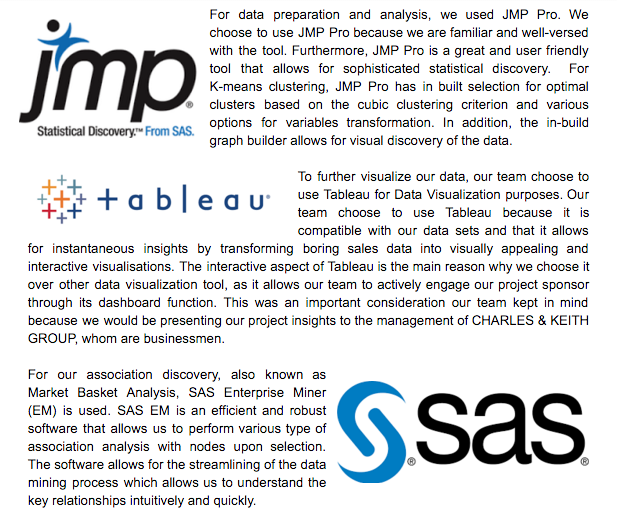
AYE Tools Used
AYE Tools Description