Difference between revisions of "AY1516 T2 Team HealthTics"
Erwin.2012 (talk | contribs) |
Sanyein.2012 (talk | contribs) |
||
| (41 intermediate revisions by 3 users not shown) | |||
| Line 8: | Line 8: | ||
| style="padding:0.1em; font-size:100%; background-color:#3498db; text-align:center; color:#F5F5F5" width="10%" | | | style="padding:0.1em; font-size:100%; background-color:#3498db; text-align:center; color:#F5F5F5" width="10%" | | ||
| − | [[AY1516 T2 | + | [[AY1516 T2 Team_HealthTics_Analysis_final|<font color="#F5F5F5" size=2.5 face="Helvetica"><b>PROJECT PROGRESS</b></font>]] |
| style="padding:0.1em; font-size:100%; background-color:#3498db; text-align:center; color:#F5F5F5" width="10%" | | | style="padding:0.1em; font-size:100%; background-color:#3498db; text-align:center; color:#F5F5F5" width="10%" | | ||
| Line 14: | Line 14: | ||
| style="padding:0.1em; font-size:100%; background-color:#3498db; text-align:center; color:#F5F5F5" width="10%" | | | style="padding:0.1em; font-size:100%; background-color:#3498db; text-align:center; color:#F5F5F5" width="10%" | | ||
| − | [[AY1516 T2 Team_HealthTics_Documents| <font color="#F5F5F5" size=2.5 face="Helvetica"><b> | + | [[AY1516 T2 Team_HealthTics_Documents| <font color="#F5F5F5" size=2.5 face="Helvetica"><b>DOCUMENTATION</b></font>]] |
|} | |} | ||
<!--Header End--> | <!--Header End--> | ||
| + | |||
| + | ==<div style="background: #3498db; padding: 13px; text-align:center; line-height: 0.3em; font-size:15px; font-family:Helvetica"><font color= #F5F5F5>PROJECT OVERVIEW</font></div>== | ||
| + | To facilitate a wider adoption of GIS analysis in HPB programme planning, this project aims to build a web application that enables HPB programme planners to analyze geospatial data more effectively in a less technical way as compared to using conventional desktop application, such as QGIS and ArcGIS. Because it is built on the cloud, this application could be easily distributable and accessible through web portal by the HPB end-users. Therefore, it will be significantly more efficient to adopt GIS analytics at the operational level of the HPB programme planning and analysis. | ||
| + | |||
| + | Our GIS web application will map out various map layers based on the CSV files uploaded by the end-users that contain the data that they want to analyze. For an uploaded CSV file that contains Geospatial data, our web application checks the data format (WGS84 or SVY21) and then will generate additional layers to the base map accordingly. If there is no Geospatial data, but only postal code or address is available, our application performs geocoding functions to get the latitude and longitude based on the available information. As such, our application allows the HPB programme planner to flexibly add and analyze new map layers representing various community facilities, such as parks, eateries, and community centres for scalable analysis. | ||
| + | |||
| + | To cater a more dynamic level of analysis, this application allows various filtering of HPB Programme Key Performance Indicators (KPI) that will be reflected on the results displayed on GIS map layers. In addition, it also allows additional filtering based on the user needs when a new KPI is added to a HPB programme planning. Hence, this functionality fulfils the dynamic needs of end-users in their analysis. | ||
| + | |||
| + | In addition, our web application enables the users to create reports based on the results that they have generated in their analysis. By exporting a report, the end-users are able to share and distribute the results more effectively to relevant stakeholders. As such, our web application satisfies the needs of the users from end-to-end, and thus, effectively improving their productivity in throughout their analysis process. | ||
==<div style="background: #3498db; padding: 13px; text-align:center; line-height: 0.3em; font-size:15px; font-family:Helvetica"><font color= #F5F5F5>MOTIVATION</font></div>== | ==<div style="background: #3498db; padding: 13px; text-align:center; line-height: 0.3em; font-size:15px; font-family:Helvetica"><font color= #F5F5F5>MOTIVATION</font></div>== | ||
| + | Founded in 2001, the Health Promotion Board (HPB) aims to build a nation of healthy people. Although residents in Singapore today enjoy good health with high life expectancy and low mortality rates, HPB wants to further improve the health status of the residents. To achieve this, HPB assumes the role of the main driver for national health promotion and disease prevention programmes. | ||
| − | + | To gather data-driven insights in facilitating its programme planning, HPB utilises Geospatial Information System (GIS) tools to analyze various facilities in different communities and planning areas. One of the challenges faced in implementing GIS-driven analysis is the knowledge gap and technology cost in the operational level. As such, for a more efficient adoption of GIS applications in the operational level, HPB intends to adopt a lightweight GIS web application to be used by HPB Programme and Outreach Executives that have limited knowledge in GIS analysis. | |
| − | |||
==<div style="background: #3498db; padding: 13px; text-align:center; line-height: 0.3em; font-size:15px; font-family:Helvetica"><font color= #F5F5F5>OBJECTIVES</font></div>== | ==<div style="background: #3498db; padding: 13px; text-align:center; line-height: 0.3em; font-size:15px; font-family:Helvetica"><font color= #F5F5F5>OBJECTIVES</font></div>== | ||
| − | + | The aim of this project is to allow Health Promotion Board agency to be more flexible in planning and analysing using geospatial functions that will be built in a web application. The web application will help to retrieve necessary data, compute useful KPI and visualize results to target users. Additionally, our application allows the users to import additional map layers that can be overlaid together with existing map layers on the application. Such a functionality makes our application more dynamic and scalable to the HPB user needs at the operational level as different requirements of analysis might occur. | |
| − | * | + | |
| − | + | Target users are HPB programme and outreach executive who may not be familiar with GIS analysis. Hence, the application needs to be intuitive, easy to use to serve the purpose of planning and analysing. | |
| − | < | + | |
| − | The application | + | ==<div style="background: #3498db; padding: 13px; text-align:center; line-height: 0.3em; font-size:15px; font-family:Helvetica"><font color= #F5F5F5>REVIEW OF SIMILAR WORK</font></div>== |
| + | ===ONE MAP=== | ||
| + | [[File:Onemap.jpeg|800px|center]] | ||
| + | OneMap is an integrated map system for government agencies to deliver location-based services and information. It is a multi-agency collaboration with many government agencies currently participating and contributing information . This web-based application is open to use for the public as well as for any organizations or business entities for geospatial-related analysis. It contains a comprehensive list of map layers as well as metadata linked to those map layers, such as population, and property market information. | ||
| + | |||
| + | In addition, OneMap serves as the aggregated services to display geospatial data for external government websites, such as BizMap , BirdWatching Hotspots , Water Level Sensors . Those services although appear to be linked to other websites, they still make use of the base map and functionalities that are inherited from OneMap. Learning from this functionality, our project could also provide a list of API’s for sharing of the base map layer and other basic geospatial functionalities to other HPB websites that require similar services. | ||
| + | |||
| + | By using OneMap, users are able to plot out geospatial data from readily-available services, such as SchoolQuery, LandQuery and PopulationQuery that readily available on its database. The concept of this functionality could be applied to our project as well, which to prepare various datasets that are commonly used by the end-users. | ||
| + | |||
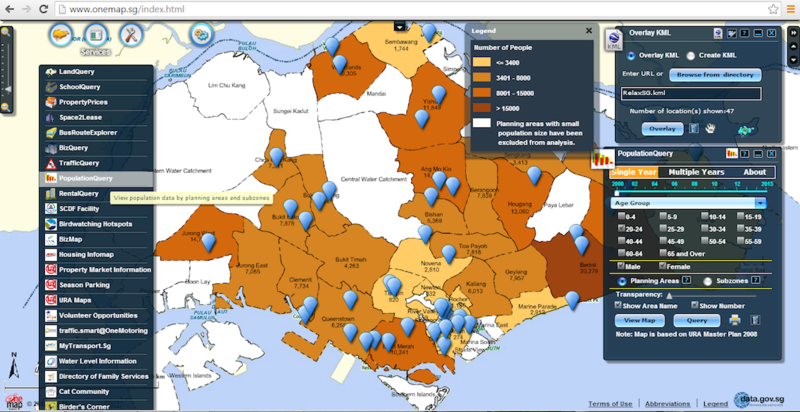
| + | Additionally, users are able to import external KML data to be overlaid on the base map layer together with existing geospatial layer in OneMap. As shown by figure 1 above, layer from RelaxSG.kml denoted by the blue pins and PopulationQuery represented by different colours on the map are overlaid together in OneMap. As such, users are able to analyse the number of parks from RelaxSG.kml together with the population in various planning areas from PopulationQuery. Again, such a functionality could be implemented in our project because it is catered to additional geospatial layers that will be added at an ad-hoc basis by HPB users. | ||
| + | |||
| + | Given the similar functionalities in both our project and those in OneMap, we have observed some limitations in OneMap that should be improved in our project. Some of those limitations are listed below: | ||
| + | * External KML datasets cannot exceed 2MB. Such limitation hinders the overlaying of large datasets. | ||
| + | * There can only be only one layer of imported KML data overlaid on the map. This means that if users want to import two KML data, they can only be viewed one at a time. | ||
| + | |||
| + | All in all, OneMap can be a reference for the implementation and design of our project, but we should note that OneMap is catered to various types of governmental bodies, whereas our project will be mainly catered to HPB. | ||
| + | |||
| + | ==<div style="background: #3498db; padding: 13px; text-align:center; line-height: 0.3em; font-size:15px; font-family:Helvetica"><font color= #F5F5F5>DATASETS</font></div>== | ||
| + | |||
| + | ===DATA SOURCES=== | ||
| + | The dataset for our projects will be mainly retrieved from the following sources: | ||
| + | # Public datasets provided by HPB on data.gov.sg: https://data.gov.sg/dataset?organization=health-promotion-board | ||
| + | # Internal dataset from Health Promotion Board. | ||
| + | |||
| + | ===DETAILS OF DATA=== | ||
| + | #Format will be in Shapefile or KML. | ||
| + | #List of different layers of health promotion options, such as park location, smoking cessation touchpoints, healthier dining outlets, et cetera. | ||
| + | |||
| + | Example of possible of park location layer: | ||
| + | {| class="wikitable" style="background-color: white;" | ||
| + | |- | ||
| + | ! style="background-color: #a8d3ef" | NAME !! style="background-color: #a8d3ef" | DESCRIPTION | ||
| + | |- | ||
| + | | <placemark> || Parent tag to contains all attribute of a park | ||
| + | |- | ||
| + | | <name> || Name tag to indicate name of a park | ||
| + | |- | ||
| + | | <description> || Description tag contain the description of a park include facilities that can be utilized in the park | ||
| + | |- | ||
| + | | <point> || Contain <coordinate> tag that will indicate the latitude and longitude of a park | ||
| + | |} | ||
| + | |||
| + | ==<div style="background: #3498db; padding: 13px; text-align:center; line-height: 0.3em; font-size:15px; font-family:Helvetica"><font color= #F5F5F5>METHODOLOGY</font></div>== | ||
| + | |||
| + | ===Data Processing=== | ||
| + | =====Data Extension Format===== | ||
| + | In this project, there are two main streams of data: HDB blocks and other layers of locations. Data will be provided by Health Promotion Board and it may be in many different extensions such as shp, kml, csv, geojson. We chose to transfer all files upload to one format which is geojson. The reason is because geojson is light weight. Hence, it helps to boost the performance of web application. | ||
| + | Furthermore, it’s easily directly used to display on the map using leafletjs. And more importantly, we can use geojson to create a necessary sub-layer from the main layer. For example, for all school type layer file include: primary, secondary, JS, we can choose to extract only primary to work on our requirement. Furthermore, geojson is a type of json which is best support on web technology | ||
| + | =====Geojson format description===== | ||
| + | Each geojson file will have either of 2 format: Feature or FeatureCollection. | ||
| + | =====Feature Format===== | ||
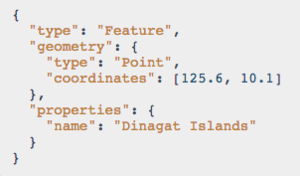
| + | Feature format will contain only one location or one points of a location or location with multiple coordinate to draw polygon or line. | ||
| + | [[File:Feature.png|300px|center|]] | ||
| + | =====FeatureCollection Format===== | ||
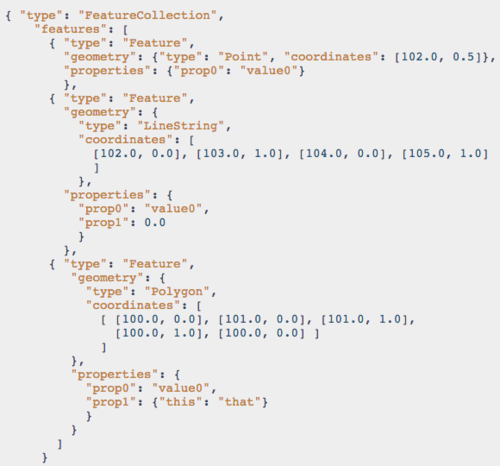
| + | FeatureCollection will contain collection of features includes include multiple points or polygon, line string. | ||
| + | [[File:FeatureCollection.png|500px|center]] | ||
| + | ====Tool to transfer data to geojson format==== | ||
| + | OGRE web client tool | ||
| + | OGRE is the popular ogr2ogr tool but on web client to transfer data from different sources to target format. | ||
| + | The API used: http://ogre.adc4gis.com/convert | ||
| + | ====Convert HDB to building polygon format==== | ||
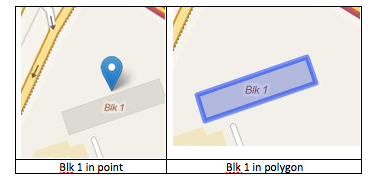
| + | Although our sponsor HPB doesn’t require to transform HDB points to building polygon, however, we think it’s crucial to improve the accuracy of results calculate. | ||
| + | =====Comparison between using points and polygon===== | ||
| + | ======Overlapping of buildings if using points====== | ||
| + | [[File:Compare1.png|500px|center]] | ||
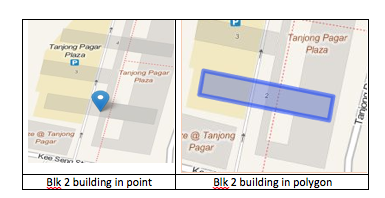
| + | The left picture show us the HDB blk 2 outtram park area in coordinate address point which created confusion because the point is overlapped with TanjonPagar plaza. Hence, when we buffer the point to 1 kilometer, it will be confused whether the buffer is for block 2 building or for Tanjong Pagar Plaza | ||
| + | ======Incorrect address point====== | ||
| + | [[File:Compare2.png|500px|center]] | ||
| + | In this situation, we can see clearly the address point received is not even within the building. | ||
| + | ====Projection==== | ||
| + | Because the final requirements of the project will involve buffer the distance from a particular location. Therefore, projection is very important because only by using correct EPSG Projection 3414 - SVY21, we can accurately measure the distance in kilometers and centimeter and calculate how many points of layers uploaded within the buffers. | ||
| + | =====Proj4js Tool projection transform===== | ||
| + | Project4js tool is a javascript library that is very useful to transform to correct coordinates of geojson data. | ||
| + | First we need to define Singapore projection as proj4.defs("EPSG:3414", "+proj=tmerc +lat_0=1.366666666666667 +lon_0=103.8333333333333 +k=1 +x_0=28001.642 +y_0=38744.572 +ellps=WGS84 +units=m +no_defs") and apply to each of the coordinate of data. | ||
| + | ====Buffering for each of HDB==== | ||
| + | For each of HDB transformed, now we would buffer the location and check whether the desired layer fall within the defined distance by the users. | ||
| + | =====Tools for buffering and checking within===== | ||
| + | Turfjs is a powerful tools to do geoprocessing on web application. It can help to buffer a feature or featureCollection. And after that, we can use turf to check whether the desired layers fall within the buffer. | ||
| + | There are many more functionalities that turfjs offer. For example, filter function is used to extract a particular group of data in geojson file. | ||
| + | Example screenshot: | ||
| + | First, users will indicate the layer required with distance and operation amount | ||
| + | [[File:FilterTable.png|400px|center]] | ||
| + | Then turfjs will buffer the location and calculate the points within the buffer. | ||
| + | [[File:DemoBuffer.png|400px|center]] | ||
| + | Turfjs API can be found at: http://turfjs.org/static/docs/ | ||
| + | |||
| + | ===Reporting and visualization=== | ||
| + | ====Requirement Explanation==== | ||
| + | =====OR requirement===== | ||
| + | [[File:filterTable.png|400px|center|]] | ||
| + | Firstly, users can input the requirements that they want for each layer such as distance, operator amount, number of points within. For each HDB and each layer, the requirement will be assessed by OR logic. | ||
| + | For example, HDB block 2 need to have at least 1 Healthy Dining, or at least 2 Park, or at least 1 smoking area within 2 kilometers. HDB block 2 will be counted if one of the requirements are fulfilled. | ||
| + | =====AND requirement===== | ||
| + | [[File:AndTable.png|400px|center|]] | ||
| + | AND requirement is the combination of all OR requirement above for a particular HDB and will be assessed by AND logic. It mean as long as there is a requirement not fulfilled. The HDB won’t be counted | ||
| + | ====Reporting==== | ||
| + | Reporting will be display after data processing. The reporting will display the number of HDB fulfil the requirements and indicate the original requirement. | ||
| + | Example screenshot: | ||
| + | ====Visualization==== | ||
| + | =====Visualization prototype===== | ||
| + | [[File:BufferPrototype.png|400px|center|]] | ||
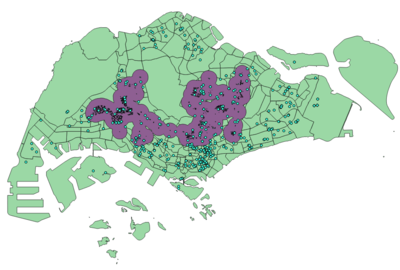
| + | Our desired visualization should cover all dissolved buffer of HDBs that fulfil the requirements. The prototype is done by using QGIS. | ||
| + | ====Tool used for visualization==== | ||
| + | =====Leafletjs===== | ||
| + | Leafletjs is a powerful tool to use data and display different layer on the map. In this project, we will be using leaflet to display the base map layer and also the buffering layers. | ||
| + | =====Turfjs with merge functionality===== | ||
| + | While turfjs were used before to create the buffer and count the points within, it also has a useful functionality of merge the buffering. By doing so, users will easily access results. | ||
| + | |||
| + | ==<div style="background: #3498db; padding: 13px; text-align:center; line-height: 0.3em; font-size:15px; font-family:Helvetica"><font color= #F5F5F5>SCOPE OF WORK</font></div>== | ||
| + | |||
| + | The project scope will be divided into three modules: | ||
| + | ===1. BASEMAP MODULE=== | ||
| + | * Display basic map on the web page | ||
| + | * Geocoding to convert postal code to latitude and longitude | ||
| + | * Create different overlay layers on Google Map, or OpenStreeMap | ||
| + | * Layer control to display/hide/switch layers | ||
| + | * Selection of icon on the overlay layer | ||
| + | * Zoom-in and Zoom-out | ||
| + | * Classify points on the map according user’s defined categories | ||
| + | |||
| + | ===2. DATA INPUT, SPATIAL SEARCH & SPATIAL ANALYTICS MODULE=== | ||
| + | ====''2.1 Data Input''==== | ||
| + | * Allow users to upload new data with postal code and display on the map | ||
| + | * Allow users to upload file with the extension of either KML or Shapefile | ||
| + | * Able to convert WGS 84 to SVY 21 | ||
| + | ====''2.2 Spatial Search''==== | ||
| + | *Allow users to search and highlight based on postal code | ||
| + | ====2.3 Spatial Analytics==== | ||
| + | *Allow users to compute necessary metrics | ||
| + | |||
| + | ===3. REPORTING DASHBOARD=== | ||
| + | *Display interactive results based on the metrics calculation | ||
| + | |||
| + | ==<div style="background: #3498db; padding: 13px; text-align:center; line-height: 0.3em; font-size:15px; font-family:Helvetica"><font color= #F5F5F5>REFERENCES</font></div>== | ||
| + | |||
| + | #StraitsTimes. (2014, May 7). One-quarter of workers report high stress levels. Retrieved from www.straitstimes.com/singapore/health/one-quarter-of-workers-report-high-stress-levels | ||
| + | #OneMap. (n.d.). OneMap. Retrieved from http://onemap.sg | ||
| + | # Singapore Land Authority. (2015, October 29). About OneMap. Retrieved from http://www.sla.gov.sg/e-Services/OneMap.aspx#.VpJjzcZ97IU | ||
| + | # EnterpriseOne. (n.d.). BizMap. Retrieved from http://apps.enterpriseone.gov.sg/Bizmap/BizmapEnterpriseone.aspx | ||
| + | # Nature Society of Singapore. (n.d.). Bird Watching Locations. Retrieved from http://www.nss.org.sg/wildbirdsingapore/Default.aspx | ||
| + | # Public Utilities Board of Singapore. (n.d.). Managing Flash Floods. Retrieved from http://www.pub.gov.sg/managingflashfloods/WLS/Pages/WaterLevelSensors.aspx | ||
| + | # 7Vatsavai, R. R., Burk, T. E., Wilson, B. T., & Shekhar, S. (2000). A Web-based browsing and spatial analysis system for regional natural resource analysis and mapping. Proceedings of the Eighth ACM International Symposium on Advances in Geographic Information Systems - GIS '00. | ||
Latest revision as of 02:03, 17 April 2016
Contents
- 1 PROJECT OVERVIEW
- 2 MOTIVATION
- 3 OBJECTIVES
- 4 REVIEW OF SIMILAR WORK
- 5 DATASETS
- 6 METHODOLOGY
- 6.1 Data Processing
- 6.2 Reporting and visualization
- 7 SCOPE OF WORK
- 8 REFERENCES
PROJECT OVERVIEW
To facilitate a wider adoption of GIS analysis in HPB programme planning, this project aims to build a web application that enables HPB programme planners to analyze geospatial data more effectively in a less technical way as compared to using conventional desktop application, such as QGIS and ArcGIS. Because it is built on the cloud, this application could be easily distributable and accessible through web portal by the HPB end-users. Therefore, it will be significantly more efficient to adopt GIS analytics at the operational level of the HPB programme planning and analysis.
Our GIS web application will map out various map layers based on the CSV files uploaded by the end-users that contain the data that they want to analyze. For an uploaded CSV file that contains Geospatial data, our web application checks the data format (WGS84 or SVY21) and then will generate additional layers to the base map accordingly. If there is no Geospatial data, but only postal code or address is available, our application performs geocoding functions to get the latitude and longitude based on the available information. As such, our application allows the HPB programme planner to flexibly add and analyze new map layers representing various community facilities, such as parks, eateries, and community centres for scalable analysis.
To cater a more dynamic level of analysis, this application allows various filtering of HPB Programme Key Performance Indicators (KPI) that will be reflected on the results displayed on GIS map layers. In addition, it also allows additional filtering based on the user needs when a new KPI is added to a HPB programme planning. Hence, this functionality fulfils the dynamic needs of end-users in their analysis.
In addition, our web application enables the users to create reports based on the results that they have generated in their analysis. By exporting a report, the end-users are able to share and distribute the results more effectively to relevant stakeholders. As such, our web application satisfies the needs of the users from end-to-end, and thus, effectively improving their productivity in throughout their analysis process.
MOTIVATION
Founded in 2001, the Health Promotion Board (HPB) aims to build a nation of healthy people. Although residents in Singapore today enjoy good health with high life expectancy and low mortality rates, HPB wants to further improve the health status of the residents. To achieve this, HPB assumes the role of the main driver for national health promotion and disease prevention programmes.
To gather data-driven insights in facilitating its programme planning, HPB utilises Geospatial Information System (GIS) tools to analyze various facilities in different communities and planning areas. One of the challenges faced in implementing GIS-driven analysis is the knowledge gap and technology cost in the operational level. As such, for a more efficient adoption of GIS applications in the operational level, HPB intends to adopt a lightweight GIS web application to be used by HPB Programme and Outreach Executives that have limited knowledge in GIS analysis.
OBJECTIVES
The aim of this project is to allow Health Promotion Board agency to be more flexible in planning and analysing using geospatial functions that will be built in a web application. The web application will help to retrieve necessary data, compute useful KPI and visualize results to target users. Additionally, our application allows the users to import additional map layers that can be overlaid together with existing map layers on the application. Such a functionality makes our application more dynamic and scalable to the HPB user needs at the operational level as different requirements of analysis might occur.
Target users are HPB programme and outreach executive who may not be familiar with GIS analysis. Hence, the application needs to be intuitive, easy to use to serve the purpose of planning and analysing.
REVIEW OF SIMILAR WORK
ONE MAP
OneMap is an integrated map system for government agencies to deliver location-based services and information. It is a multi-agency collaboration with many government agencies currently participating and contributing information . This web-based application is open to use for the public as well as for any organizations or business entities for geospatial-related analysis. It contains a comprehensive list of map layers as well as metadata linked to those map layers, such as population, and property market information.
In addition, OneMap serves as the aggregated services to display geospatial data for external government websites, such as BizMap , BirdWatching Hotspots , Water Level Sensors . Those services although appear to be linked to other websites, they still make use of the base map and functionalities that are inherited from OneMap. Learning from this functionality, our project could also provide a list of API’s for sharing of the base map layer and other basic geospatial functionalities to other HPB websites that require similar services.
By using OneMap, users are able to plot out geospatial data from readily-available services, such as SchoolQuery, LandQuery and PopulationQuery that readily available on its database. The concept of this functionality could be applied to our project as well, which to prepare various datasets that are commonly used by the end-users.
Additionally, users are able to import external KML data to be overlaid on the base map layer together with existing geospatial layer in OneMap. As shown by figure 1 above, layer from RelaxSG.kml denoted by the blue pins and PopulationQuery represented by different colours on the map are overlaid together in OneMap. As such, users are able to analyse the number of parks from RelaxSG.kml together with the population in various planning areas from PopulationQuery. Again, such a functionality could be implemented in our project because it is catered to additional geospatial layers that will be added at an ad-hoc basis by HPB users.
Given the similar functionalities in both our project and those in OneMap, we have observed some limitations in OneMap that should be improved in our project. Some of those limitations are listed below:
- External KML datasets cannot exceed 2MB. Such limitation hinders the overlaying of large datasets.
- There can only be only one layer of imported KML data overlaid on the map. This means that if users want to import two KML data, they can only be viewed one at a time.
All in all, OneMap can be a reference for the implementation and design of our project, but we should note that OneMap is catered to various types of governmental bodies, whereas our project will be mainly catered to HPB.
DATASETS
DATA SOURCES
The dataset for our projects will be mainly retrieved from the following sources:
- Public datasets provided by HPB on data.gov.sg: https://data.gov.sg/dataset?organization=health-promotion-board
- Internal dataset from Health Promotion Board.
DETAILS OF DATA
- Format will be in Shapefile or KML.
- List of different layers of health promotion options, such as park location, smoking cessation touchpoints, healthier dining outlets, et cetera.
Example of possible of park location layer:
| NAME | DESCRIPTION |
|---|---|
| <placemark> | Parent tag to contains all attribute of a park |
| <name> | Name tag to indicate name of a park |
| <description> | Description tag contain the description of a park include facilities that can be utilized in the park |
| <point> | Contain <coordinate> tag that will indicate the latitude and longitude of a park |
METHODOLOGY
Data Processing
Data Extension Format
In this project, there are two main streams of data: HDB blocks and other layers of locations. Data will be provided by Health Promotion Board and it may be in many different extensions such as shp, kml, csv, geojson. We chose to transfer all files upload to one format which is geojson. The reason is because geojson is light weight. Hence, it helps to boost the performance of web application. Furthermore, it’s easily directly used to display on the map using leafletjs. And more importantly, we can use geojson to create a necessary sub-layer from the main layer. For example, for all school type layer file include: primary, secondary, JS, we can choose to extract only primary to work on our requirement. Furthermore, geojson is a type of json which is best support on web technology
Geojson format description
Each geojson file will have either of 2 format: Feature or FeatureCollection.
Feature Format
Feature format will contain only one location or one points of a location or location with multiple coordinate to draw polygon or line.
FeatureCollection Format
FeatureCollection will contain collection of features includes include multiple points or polygon, line string.
Tool to transfer data to geojson format
OGRE web client tool OGRE is the popular ogr2ogr tool but on web client to transfer data from different sources to target format. The API used: http://ogre.adc4gis.com/convert
Convert HDB to building polygon format
Although our sponsor HPB doesn’t require to transform HDB points to building polygon, however, we think it’s crucial to improve the accuracy of results calculate.
Comparison between using points and polygon
Overlapping of buildings if using points
The left picture show us the HDB blk 2 outtram park area in coordinate address point which created confusion because the point is overlapped with TanjonPagar plaza. Hence, when we buffer the point to 1 kilometer, it will be confused whether the buffer is for block 2 building or for Tanjong Pagar Plaza
Incorrect address point
In this situation, we can see clearly the address point received is not even within the building.
Projection
Because the final requirements of the project will involve buffer the distance from a particular location. Therefore, projection is very important because only by using correct EPSG Projection 3414 - SVY21, we can accurately measure the distance in kilometers and centimeter and calculate how many points of layers uploaded within the buffers.
Proj4js Tool projection transform
Project4js tool is a javascript library that is very useful to transform to correct coordinates of geojson data. First we need to define Singapore projection as proj4.defs("EPSG:3414", "+proj=tmerc +lat_0=1.366666666666667 +lon_0=103.8333333333333 +k=1 +x_0=28001.642 +y_0=38744.572 +ellps=WGS84 +units=m +no_defs") and apply to each of the coordinate of data.
Buffering for each of HDB
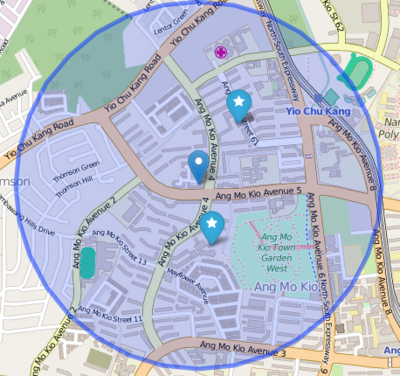
For each of HDB transformed, now we would buffer the location and check whether the desired layer fall within the defined distance by the users.
Tools for buffering and checking within
Turfjs is a powerful tools to do geoprocessing on web application. It can help to buffer a feature or featureCollection. And after that, we can use turf to check whether the desired layers fall within the buffer. There are many more functionalities that turfjs offer. For example, filter function is used to extract a particular group of data in geojson file. Example screenshot: First, users will indicate the layer required with distance and operation amount
Then turfjs will buffer the location and calculate the points within the buffer.
Turfjs API can be found at: http://turfjs.org/static/docs/
Reporting and visualization
Requirement Explanation
OR requirement
Firstly, users can input the requirements that they want for each layer such as distance, operator amount, number of points within. For each HDB and each layer, the requirement will be assessed by OR logic. For example, HDB block 2 need to have at least 1 Healthy Dining, or at least 2 Park, or at least 1 smoking area within 2 kilometers. HDB block 2 will be counted if one of the requirements are fulfilled.
AND requirement
AND requirement is the combination of all OR requirement above for a particular HDB and will be assessed by AND logic. It mean as long as there is a requirement not fulfilled. The HDB won’t be counted
Reporting
Reporting will be display after data processing. The reporting will display the number of HDB fulfil the requirements and indicate the original requirement. Example screenshot:
Visualization
Visualization prototype
Our desired visualization should cover all dissolved buffer of HDBs that fulfil the requirements. The prototype is done by using QGIS.
Tool used for visualization
Leafletjs
Leafletjs is a powerful tool to use data and display different layer on the map. In this project, we will be using leaflet to display the base map layer and also the buffering layers.
Turfjs with merge functionality
While turfjs were used before to create the buffer and count the points within, it also has a useful functionality of merge the buffering. By doing so, users will easily access results.
SCOPE OF WORK
The project scope will be divided into three modules:
1. BASEMAP MODULE
- Display basic map on the web page
- Geocoding to convert postal code to latitude and longitude
- Create different overlay layers on Google Map, or OpenStreeMap
- Layer control to display/hide/switch layers
- Selection of icon on the overlay layer
- Zoom-in and Zoom-out
- Classify points on the map according user’s defined categories
2. DATA INPUT, SPATIAL SEARCH & SPATIAL ANALYTICS MODULE
2.1 Data Input
- Allow users to upload new data with postal code and display on the map
- Allow users to upload file with the extension of either KML or Shapefile
- Able to convert WGS 84 to SVY 21
2.2 Spatial Search
- Allow users to search and highlight based on postal code
2.3 Spatial Analytics
- Allow users to compute necessary metrics
3. REPORTING DASHBOARD
- Display interactive results based on the metrics calculation
REFERENCES
- StraitsTimes. (2014, May 7). One-quarter of workers report high stress levels. Retrieved from www.straitstimes.com/singapore/health/one-quarter-of-workers-report-high-stress-levels
- OneMap. (n.d.). OneMap. Retrieved from http://onemap.sg
- Singapore Land Authority. (2015, October 29). About OneMap. Retrieved from http://www.sla.gov.sg/e-Services/OneMap.aspx#.VpJjzcZ97IU
- EnterpriseOne. (n.d.). BizMap. Retrieved from http://apps.enterpriseone.gov.sg/Bizmap/BizmapEnterpriseone.aspx
- Nature Society of Singapore. (n.d.). Bird Watching Locations. Retrieved from http://www.nss.org.sg/wildbirdsingapore/Default.aspx
- Public Utilities Board of Singapore. (n.d.). Managing Flash Floods. Retrieved from http://www.pub.gov.sg/managingflashfloods/WLS/Pages/WaterLevelSensors.aspx
- 7Vatsavai, R. R., Burk, T. E., Wilson, B. T., & Shekhar, S. (2000). A Web-based browsing and spatial analysis system for regional natural resource analysis and mapping. Proceedings of the Eighth ACM International Symposium on Advances in Geographic Information Systems - GIS '00.
