Difference between revisions of "AY1516 T2 Group 18 Project Overview"
| Line 82: | Line 82: | ||
The Likelihood Ratio and Pearson’s chi-squared tests were then carried out to determine and sieve out statistically significant variables at the 0.05 level. After which, a test of association between all (categorical) variables against each other was then carried out to ensure that the variables selected for model building in the later phase are all independent variables. This helps to ensure the accuracy of our end results.<br><br> | The Likelihood Ratio and Pearson’s chi-squared tests were then carried out to determine and sieve out statistically significant variables at the 0.05 level. After which, a test of association between all (categorical) variables against each other was then carried out to ensure that the variables selected for model building in the later phase are all independent variables. This helps to ensure the accuracy of our end results.<br><br> | ||
| + | Since our dataset consist of mostly categorical variables, we needed to research and explore the types of predictive modelling suitable for our dataset. While logistic regression proved to be a viable option as it is able to take into consideration categorical variables through the creation of dummy variables, we realized that with the sheer number of categorical variables in the dataset (as opposed to continuous variables), logistic regression would end up yielding unsatisfactory results since it is not quite suited for our data. Instead, we opted for recursive partition to build our model. Not only is the recursive partition approach able to deal with categorical predictor variables without treating them as if they were measured on an interval or ratio scale, recursive partition, being a non-parametric approach, is also able to deal with the so-called small n large p case, unlike in parametric models where interaction effects of high order cannot be included (see Strobl, Carolin ; Malley, James ; Tutz, Gerhard Maxwell, Scott E., 2009). We evaluate our model by assessing the misclassification rate and confusion matrix at each iteration, then subsequently improve our model through revisions and future iterations. The misclassification rate represents the global accuracy of our prediction model, indicating the proportion of incorrect classifications over the total sampled. On the other hand, the confusion matrix represents a two-way classification of actual and predicted responses. Our aim is to be able to effectively minimize the misclassification rate while at the same time, achieving a high true positive rate. At the end of our project, we hope to be able to reach a satisfactory number of explanatory variables that can best predict and classify the customers and behaviors of Personal Care. | ||
| − | + | <br> | |
| − | |||
<div align="left"> | <div align="left"> | ||
Revision as of 23:33, 28 February 2016
Contents
Sponsor Background Information
Taylor Nelson Sofres (TNS) is one of the largest research agencies worldwide. They provide actionable insights to help companies make impactful decisions that drive growth. TNS is part of Kantar, one of the world's largest insight, information and consultancy group.
Introduction and Project Background
Understanding your target audience remains at the heart of successful marketing. The Connected Life is TNS's global syndicated study to understand connected consumer better. It is the largest and most comprehensive study of digital behavior of global consumers across the world.
The need for the study includes the following:
a) There was a gap in the market as no one was offering such comprehensive information about digital consumers
b) It was cost prohibitive for one client to undertake such a global venture and hence, clients were only doing these studies selectively and where budgets allowed
c) Other studies which also claim to have such a global footprint were either by publishers themselves or by media agencies, thus clients are apprehensive that the analysis offered by them is biased and hence an independent study like Connected Life has great appeal.
Project Motivation
With the advent of the internet and digital devices over the past decade, it has become increasingly complex to understand and influence the choices of consumers. The media landscape has been shifting and traditional marketing approaches no longer work as well today. Many companies start to rely on digital marketing to reach out to consumers, where digital media growth have been estimated at 4.5 trillion online advertisements served annually with digital media spend to be at 48% in 2010. Whilst that is true, the power of traditional marketing approaches cannot be considered obsolete nor neglected in any way as there are cases when dealing with certain products and consumers where it still proves to be more effective. As such, businesses now face a difficulty in deciding and allocating the right amount of marketing resources to reap the best results from their target consumers.
As the Connected Life study conducted by TNS covers across over 50 countries and 58 product categories, we have been given the datasets from two markets - Singapore and Malaysia for our project. Delving down, we have chosen to focus our efforts on the Personal Care sector, under the branch of Fast-Moving Consumer Goods (FMCG) industry for the purpose of our analysis.
Project Objectives
The aim of this project is to help marketers from the FMCG - Personal Care industry to identify target consumer profiles, digital media platforms, and as well as devices to allow for more targeted marketing strategies, thus maximizing return on investment (ROI) on their business decisions.
In order to do so, we have identified 5 main objectives that we would like to answer by the end of this project. These objectives follow through a step-by-step process of identifying, connecting, engaging, and lastly, having the power to influence at the end of it:
- Who are our target consumers?
- What are the digital media platforms and devices that allow marketers to get to my target consumers and connect with them?
- How do marketers improve their touchpoint planning?
- What are the digital media platforms and content that needs to be prioritized in order to drive engagement and advocacy amongst the target consumers?
- After engagement is done, how do marketers influence the mindsets and decisions of the connected consumer?
Project Methodology
See here for more information about our data
Modelling Process:
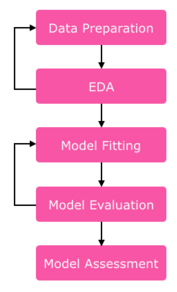
After data preparation, we first sieved out a set of relevant variables from the dataset that would help to answer each of our 5 objectives (i.e. identify target segments and their digital behavior to allow marketers to connect to them, identify how to engage target consumers and prioritize marketing efforts, and lastly, identify the ways to influence their decisions). We employed the use of different sections of the questionnaire variables to help us answer the different phases and needs of the objectives.
Before we construct our model, we carried out exploratory data analysis by looking at the data distributions across all variables. Besides ensuring that the data has been properly cleaned, it also helps us to get a feel of the distribution of responses for each question and whether it makes sense, and helps us to form initial expectations of the results. For example, we split the distributions according to the response variable (G1. Products purchased P4W - NET - Personal Care) into customers and non-customers of Personal Care to see if there are any obvious discrepancies or patterns in the distributions of the potential predictor variables. We then use that observation to form initial expectations of our model. An example would be Gender, where we observed a greater proportion of female as compared to male who are customers of Personal Care, while the reverse is observed for people who do not buy Personal Care products.
The Likelihood Ratio and Pearson’s chi-squared tests were then carried out to determine and sieve out statistically significant variables at the 0.05 level. After which, a test of association between all (categorical) variables against each other was then carried out to ensure that the variables selected for model building in the later phase are all independent variables. This helps to ensure the accuracy of our end results.
Since our dataset consist of mostly categorical variables, we needed to research and explore the types of predictive modelling suitable for our dataset. While logistic regression proved to be a viable option as it is able to take into consideration categorical variables through the creation of dummy variables, we realized that with the sheer number of categorical variables in the dataset (as opposed to continuous variables), logistic regression would end up yielding unsatisfactory results since it is not quite suited for our data. Instead, we opted for recursive partition to build our model. Not only is the recursive partition approach able to deal with categorical predictor variables without treating them as if they were measured on an interval or ratio scale, recursive partition, being a non-parametric approach, is also able to deal with the so-called small n large p case, unlike in parametric models where interaction effects of high order cannot be included (see Strobl, Carolin ; Malley, James ; Tutz, Gerhard Maxwell, Scott E., 2009). We evaluate our model by assessing the misclassification rate and confusion matrix at each iteration, then subsequently improve our model through revisions and future iterations. The misclassification rate represents the global accuracy of our prediction model, indicating the proportion of incorrect classifications over the total sampled. On the other hand, the confusion matrix represents a two-way classification of actual and predicted responses. Our aim is to be able to effectively minimize the misclassification rate while at the same time, achieving a high true positive rate. At the end of our project, we hope to be able to reach a satisfactory number of explanatory variables that can best predict and classify the customers and behaviors of Personal Care.
Project Limitations & Asssumptions
- Datasets given by the sponsor are only based on 2 markets - Singapore and Malaysia, and thus the analysis cannot be a representative for other markets.