Difference between revisions of "AY1516 T2 Team HealthTics Analysis"
Sanyein.2012 (talk | contribs) |
Sanyein.2012 (talk | contribs) |
||
| (2 intermediate revisions by the same user not shown) | |||
| Line 44: | Line 44: | ||
=== CHANGES IN USER INTERFACE === | === CHANGES IN USER INTERFACE === | ||
| − | ===Version 1=== | + | ====Version 1==== |
[[File:Healthtics prototype 1.jpg|800px|center]] | [[File:Healthtics prototype 1.jpg|800px|center]] | ||
| Line 50: | Line 50: | ||
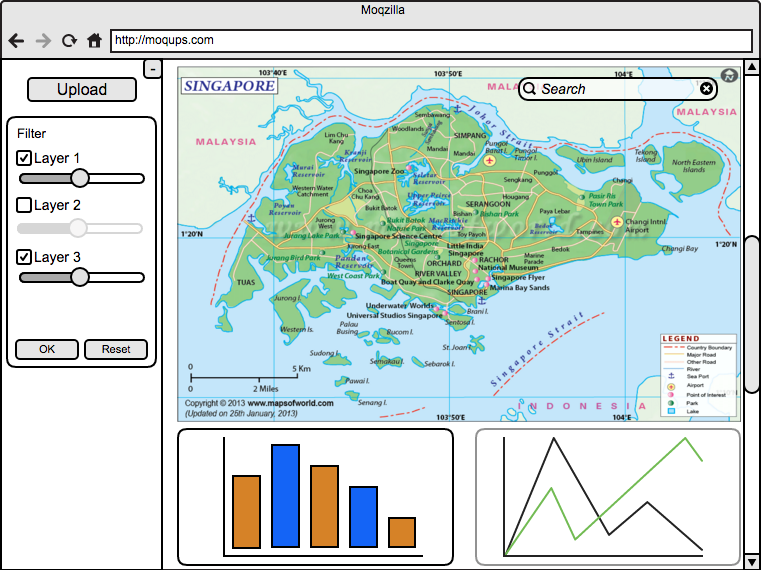
As shown above, the initial storyboard was designed to cater to the file upload and mapping function that were mentioned during a meeting with the sponsor. On the left hand side of the user interface, there are filters to select how many points to be shown on the map. The bottom of the page is reserved for displaying charts that are related to the analysis performed on the map. However, as there are more discussions with our project supervisor and project sponsor, this version of storyboard is not able to meet the client’s requirement. As such, our team designed the next version of the storyboard. | As shown above, the initial storyboard was designed to cater to the file upload and mapping function that were mentioned during a meeting with the sponsor. On the left hand side of the user interface, there are filters to select how many points to be shown on the map. The bottom of the page is reserved for displaying charts that are related to the analysis performed on the map. However, as there are more discussions with our project supervisor and project sponsor, this version of storyboard is not able to meet the client’s requirement. As such, our team designed the next version of the storyboard. | ||
| − | ===Version 1.1=== | + | ====Version 1.1==== |
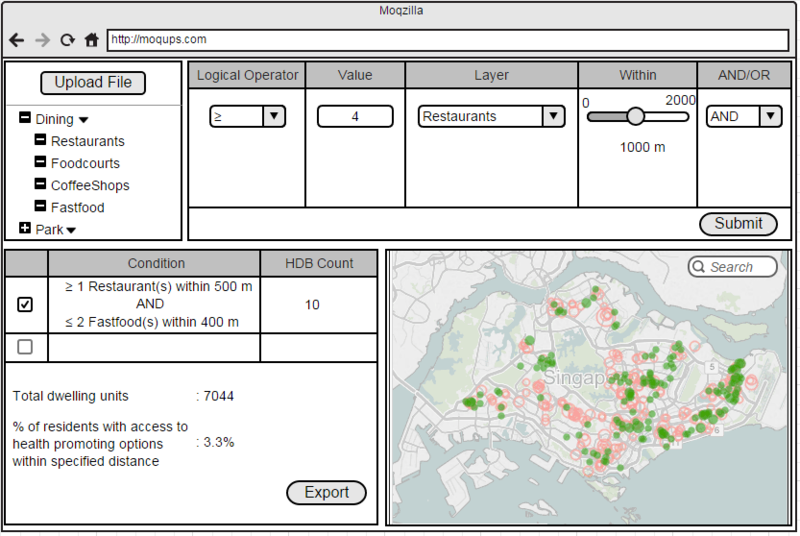
After receiving feedbacks from both Prof Kam and our sponsor, we have revised on our mockup to improve functionality and feasibility. In this new mockup, HPB programme planners can upload files (both spatial and non-spatial) to add layers. Parent/child trees would satisfy the business requirement of categories and sub-categories. For example, fast-food chain is a sub-category of main category dining Planners can define criteria and choose "AND" "OR" situation of selected criteria. Toggle feature is added for better and less crowded visualization on the map so that planners can pick certain criteria to highlight on the map. | After receiving feedbacks from both Prof Kam and our sponsor, we have revised on our mockup to improve functionality and feasibility. In this new mockup, HPB programme planners can upload files (both spatial and non-spatial) to add layers. Parent/child trees would satisfy the business requirement of categories and sub-categories. For example, fast-food chain is a sub-category of main category dining Planners can define criteria and choose "AND" "OR" situation of selected criteria. Toggle feature is added for better and less crowded visualization on the map so that planners can pick certain criteria to highlight on the map. | ||
| Line 71: | Line 71: | ||
==<div style="background: #3498db; padding: 13px; text-align:center; line-height: 0.3em; font-size:15px; font-family:Helvetica"><font color= #F5F5F5>REVISED METHODOLOGIES</font></div>== | ==<div style="background: #3498db; padding: 13px; text-align:center; line-height: 0.3em; font-size:15px; font-family:Helvetica"><font color= #F5F5F5>REVISED METHODOLOGIES</font></div>== | ||
| + | ===Data Processing=== | ||
| + | =====Data Extension Format===== | ||
| + | In this project, there are two main streams of data: HDB blocks and other layers of locations. Data will be provided by Health Promotion Board and it may be in many different extensions such as shp, kml, csv, geojson. We chose to transfer all files upload to one format which is geojson. The reason is because geojson is light weight. Hence, it helps to boost the performance of web application. | ||
| + | Furthermore, it’s easily directly used to display on the map using leafletjs. And more importantly, we can use geojson to create a necessary sub-layer from the main layer. For example, for all school type layer file include: primary, secondary, JS, we can choose to extract only primary to work on our requirement. Furthermore, geojson is a type of json which is best support on web technology | ||
| + | =====Geojson format description===== | ||
| + | Each geojson file will have either of 2 format: Feature or FeatureCollection. | ||
| + | =====Feature Format===== | ||
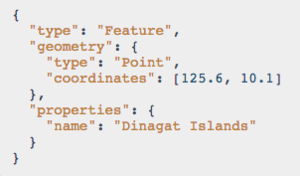
| + | Feature format will contain only one location or one points of a location or location with multiple coordinate to draw polygon or line. | ||
| + | [[File:Feature.png|300px|center|]] | ||
| + | =====FeatureCollection Format===== | ||
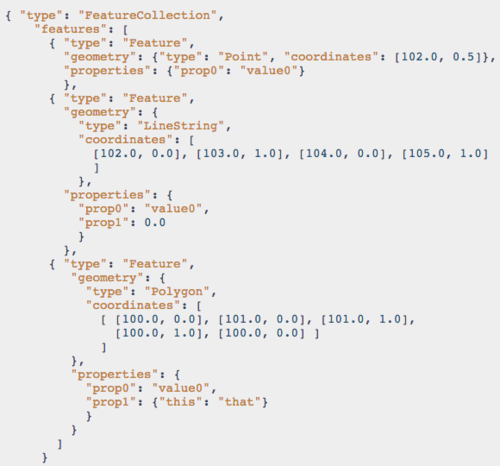
| + | FeatureCollection will contain collection of features includes include multiple points or polygon, line string. | ||
| + | [[File:FeatureCollection.png|500px|center]] | ||
| + | ====Tool to transfer data to geojson format==== | ||
| + | OGRE web client tool | ||
| + | OGRE is the popular ogr2ogr tool but on web client to transfer data from different sources to target format. | ||
| + | The API used: http://ogre.adc4gis.com/convert | ||
| + | ====Convert HDB to building polygon format==== | ||
| + | Although our sponsor HPB doesn’t require to transform HDB points to building polygon, however, we think it’s crucial to improve the accuracy of results calculate. | ||
| + | =====Comparison between using points and polygon===== | ||
| + | ======Overlapping of buildings if using points====== | ||
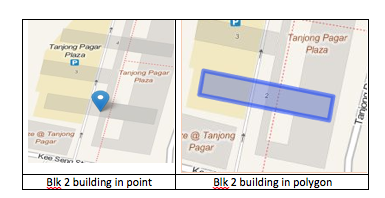
| + | [[File:Compare1.png|500px|center]] | ||
| + | The left picture show us the HDB blk 2 outtram park area in coordinate address point which created confusion because the point is overlapped with TanjonPagar plaza. Hence, when we buffer the point to 1 kilometer, it will be confused whether the buffer is for block 2 building or for Tanjong Pagar Plaza | ||
| + | ======Incorrect address point====== | ||
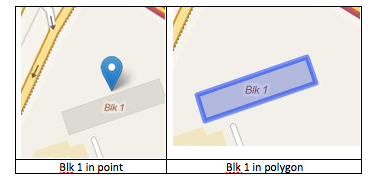
| + | [[File:Compare2.png|500px|center]] | ||
| + | In this situation, we can see clearly the address point received is not even within the building. | ||
| + | ====Projection==== | ||
| + | Because the final requirements of the project will involve buffer the distance from a particular location. Therefore, projection is very important because only by using correct EPSG Projection 3414 - SVY21, we can accurately measure the distance in kilometers and centimeter and calculate how many points of layers uploaded within the buffers. | ||
| + | =====Proj4js Tool projection transform===== | ||
| + | Project4js tool is a javascript library that is very useful to transform to correct coordinates of geojson data. | ||
| + | First we need to define Singapore projection as proj4.defs("EPSG:3414", "+proj=tmerc +lat_0=1.366666666666667 +lon_0=103.8333333333333 +k=1 +x_0=28001.642 +y_0=38744.572 +ellps=WGS84 +units=m +no_defs") and apply to each of the coordinate of data. | ||
| + | ====Buffering for each of HDB==== | ||
| + | For each of HDB transformed, now we would buffer the location and check whether the desired layer fall within the defined distance by the users. | ||
| + | =====Tools for buffering and checking within===== | ||
| + | Turfjs is a powerful tools to do geoprocessing on web application. It can help to buffer a feature or featureCollection. And after that, we can use turf to check whether the desired layers fall within the buffer. | ||
| + | There are many more functionalities that turfjs offer. For example, filter function is used to extract a particular group of data in geojson file. | ||
| + | Example screenshot: | ||
| + | First, users will indicate the layer required with distance and operation amount | ||
| + | [[File:FilterTable.png|400px|center]] | ||
| + | Then turfjs will buffer the location and calculate the points within the buffer. | ||
| + | [[File:DemoBuffer.png|400px|center]] | ||
| + | Turfjs API can be found at: http://turfjs.org/static/docs/ | ||
| + | |||
| + | ===Reporting and visualization=== | ||
| + | ====Requirement Explanation==== | ||
| + | =====OR requirement===== | ||
| + | [[File:filterTable.png|400px|center|]] | ||
| + | Firstly, users can input the requirements that they want for each layer such as distance, operator amount, number of points within. For each HDB and each layer, the requirement will be assessed by OR logic. | ||
| + | For example, HDB block 2 need to have at least 1 Healthy Dining, or at least 2 Park, or at least 1 smoking area within 2 kilometers. HDB block 2 will be counted if one of the requirements are fulfilled. | ||
| + | =====AND requirement===== | ||
| + | [[File:AndTable.png|400px|center|]] | ||
| + | AND requirement is the combination of all OR requirement above for a particular HDB and will be assessed by AND logic. It mean as long as there is a requirement not fulfilled. The HDB won’t be counted | ||
| + | ====Reporting==== | ||
| + | Reporting will be display after data processing. The reporting will display the number of HDB fulfil the requirements and indicate the original requirement. | ||
| + | Example screenshot: | ||
| + | ====Visualization==== | ||
| + | =====Visualization prototype===== | ||
| + | [[File:BufferPrototype.png|400px|center|]] | ||
| + | Our desired visualization should cover all dissolved buffer of HDBs that fulfil the requirements. The prototype is done by using QGIS. | ||
| + | ====Tool used for visualization==== | ||
| + | =====Leafletjs===== | ||
| + | Leafletjs is a powerful tool to use data and display different layer on the map. In this project, we will be using leaflet to display the base map layer and also the buffering layers. | ||
| + | =====Turfjs with merge functionality===== | ||
| + | While turfjs were used before to create the buffer and count the points within, it also has a useful functionality of merge the buffering. By doing so, users will easily access results. | ||
==<div style="background: #3498db; padding: 13px; text-align:center; line-height: 0.3em; font-size:15px; font-family:Helvetica"><font color= #F5F5F5>REFERENCES</font></div>== | ==<div style="background: #3498db; padding: 13px; text-align:center; line-height: 0.3em; font-size:15px; font-family:Helvetica"><font color= #F5F5F5>REFERENCES</font></div>== | ||
Latest revision as of 21:54, 28 February 2016
| MIDTERM PROGRESS | FINAL PROGRESS |
Contents
- 1 PROJECT UPDATE
- 2 REVISED METHODOLOGIES
- 2.1 Data Processing
- 2.2 Reporting and visualization
- 3 REFERENCES
PROJECT UPDATE
REVIEW OF SIMILAR WORK
In the article “A Web-based browsing and spatial analysis system for regional natural resource analysis and mapping”, the authors have discussed that traditional GIS techniques and tools are lack of efficiency and easy to use delivery mechanism. For example, installation or hosting of GIS application and knowledge about geographic and GIS are required. Due to these constraints, many professionals outside GIS community have difficulties in applying GIS techniques in their practical uses. As such, more flexible and feasible web-based GIS applications are introduced.
The authors also explained about the earlier versions of server-centric web GIS applications which resulted in overloading the server. Because of performance issues as well as more flexible and advanced programming languages, client-side web GIS are now widely used by professionals in many fields. The flexible programming languages help create a customised environment for the end users so that knowledge about GIS techniques is no longer required in practical applications.
Moreover, the article gave an example of load-balanced web GIS application, WebSAS. WebSAS follows 3-tier architecture: client, application server and database. The architecture spreads out the work load in each tier and the database system provides image files so that the end user do not need understanding about geographic elements.
The key factors of web-based GIS application are efficiency and ease of use. Developers need to focus on load balancing for efficient data retrieval/access, apply proper GIS techniques, and understand end-user’s requirement from the application.
DATA FLOW
NOTE: Highlight the analytical problems we are facing and how we overcome with the data flow that we revised.
CHANGES IN USER INTERFACE
Version 1
As shown above, the initial storyboard was designed to cater to the file upload and mapping function that were mentioned during a meeting with the sponsor. On the left hand side of the user interface, there are filters to select how many points to be shown on the map. The bottom of the page is reserved for displaying charts that are related to the analysis performed on the map. However, as there are more discussions with our project supervisor and project sponsor, this version of storyboard is not able to meet the client’s requirement. As such, our team designed the next version of the storyboard.
Version 1.1
After receiving feedbacks from both Prof Kam and our sponsor, we have revised on our mockup to improve functionality and feasibility. In this new mockup, HPB programme planners can upload files (both spatial and non-spatial) to add layers. Parent/child trees would satisfy the business requirement of categories and sub-categories. For example, fast-food chain is a sub-category of main category dining Planners can define criteria and choose "AND" "OR" situation of selected criteria. Toggle feature is added for better and less crowded visualization on the map so that planners can pick certain criteria to highlight on the map.
DATA SOURCE
NOTE: Highlight how is it being used by the client in the application
METHODOLOGY AND TECHNOLOGY
NOTE: make sure to describe how these technologies will be used in the application. Highlight the analytical problems we are facing and how we overcome with the methodology and technology.
- GDAL
- OGR2OGR
- TURF.JS
- PAPAPARSE
SYSTEM ARCHITECTURE
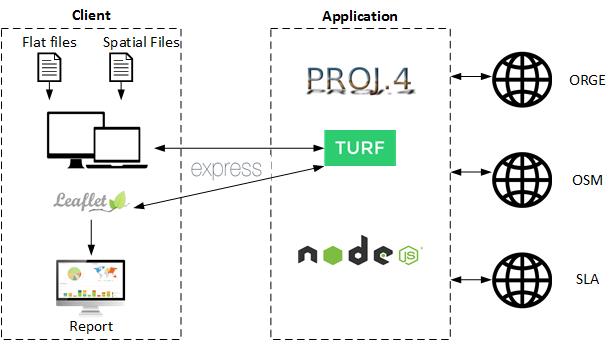
Based on our research, efficiency of web GIS application largely depends on load balancing framework. To reduce overburdening the server and cost of investment in infrastructure for large servers, our group decides to use client centric web GIS with 2 tiers: Client and Application.
REVISED METHODOLOGIES
Data Processing
Data Extension Format
In this project, there are two main streams of data: HDB blocks and other layers of locations. Data will be provided by Health Promotion Board and it may be in many different extensions such as shp, kml, csv, geojson. We chose to transfer all files upload to one format which is geojson. The reason is because geojson is light weight. Hence, it helps to boost the performance of web application. Furthermore, it’s easily directly used to display on the map using leafletjs. And more importantly, we can use geojson to create a necessary sub-layer from the main layer. For example, for all school type layer file include: primary, secondary, JS, we can choose to extract only primary to work on our requirement. Furthermore, geojson is a type of json which is best support on web technology
Geojson format description
Each geojson file will have either of 2 format: Feature or FeatureCollection.
Feature Format
Feature format will contain only one location or one points of a location or location with multiple coordinate to draw polygon or line.
FeatureCollection Format
FeatureCollection will contain collection of features includes include multiple points or polygon, line string.
Tool to transfer data to geojson format
OGRE web client tool OGRE is the popular ogr2ogr tool but on web client to transfer data from different sources to target format. The API used: http://ogre.adc4gis.com/convert
Convert HDB to building polygon format
Although our sponsor HPB doesn’t require to transform HDB points to building polygon, however, we think it’s crucial to improve the accuracy of results calculate.
Comparison between using points and polygon
Overlapping of buildings if using points
The left picture show us the HDB blk 2 outtram park area in coordinate address point which created confusion because the point is overlapped with TanjonPagar plaza. Hence, when we buffer the point to 1 kilometer, it will be confused whether the buffer is for block 2 building or for Tanjong Pagar Plaza
Incorrect address point
In this situation, we can see clearly the address point received is not even within the building.
Projection
Because the final requirements of the project will involve buffer the distance from a particular location. Therefore, projection is very important because only by using correct EPSG Projection 3414 - SVY21, we can accurately measure the distance in kilometers and centimeter and calculate how many points of layers uploaded within the buffers.
Proj4js Tool projection transform
Project4js tool is a javascript library that is very useful to transform to correct coordinates of geojson data. First we need to define Singapore projection as proj4.defs("EPSG:3414", "+proj=tmerc +lat_0=1.366666666666667 +lon_0=103.8333333333333 +k=1 +x_0=28001.642 +y_0=38744.572 +ellps=WGS84 +units=m +no_defs") and apply to each of the coordinate of data.
Buffering for each of HDB
For each of HDB transformed, now we would buffer the location and check whether the desired layer fall within the defined distance by the users.
Tools for buffering and checking within
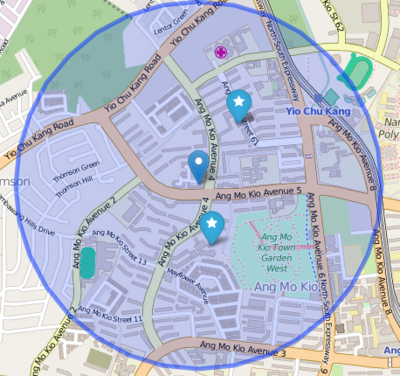
Turfjs is a powerful tools to do geoprocessing on web application. It can help to buffer a feature or featureCollection. And after that, we can use turf to check whether the desired layers fall within the buffer. There are many more functionalities that turfjs offer. For example, filter function is used to extract a particular group of data in geojson file. Example screenshot: First, users will indicate the layer required with distance and operation amount
Then turfjs will buffer the location and calculate the points within the buffer.
Turfjs API can be found at: http://turfjs.org/static/docs/
Reporting and visualization
Requirement Explanation
OR requirement
Firstly, users can input the requirements that they want for each layer such as distance, operator amount, number of points within. For each HDB and each layer, the requirement will be assessed by OR logic. For example, HDB block 2 need to have at least 1 Healthy Dining, or at least 2 Park, or at least 1 smoking area within 2 kilometers. HDB block 2 will be counted if one of the requirements are fulfilled.
AND requirement
AND requirement is the combination of all OR requirement above for a particular HDB and will be assessed by AND logic. It mean as long as there is a requirement not fulfilled. The HDB won’t be counted
Reporting
Reporting will be display after data processing. The reporting will display the number of HDB fulfil the requirements and indicate the original requirement. Example screenshot:
Visualization
Visualization prototype
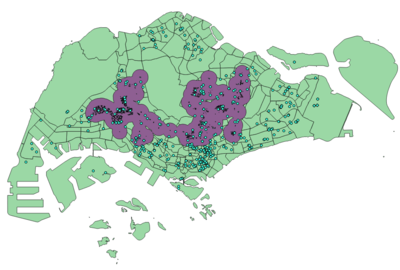
Our desired visualization should cover all dissolved buffer of HDBs that fulfil the requirements. The prototype is done by using QGIS.
Tool used for visualization
Leafletjs
Leafletjs is a powerful tool to use data and display different layer on the map. In this project, we will be using leaflet to display the base map layer and also the buffering layers.
Turfjs with merge functionality
While turfjs were used before to create the buffer and count the points within, it also has a useful functionality of merge the buffering. By doing so, users will easily access results.
REFERENCES
StraitsTimes. (2014, May 7). One-quarter of workers report high stress levels. Retrieved from www.straitstimes.com/singapore/health/one-quarter-of-workers-report-high-stress-levels
OneMap. (n.d.). OneMap. Retrieved from http://onemap.sg
Singapore Land Authority. (2015, October 29). About OneMap. Retrieved from http://www.sla.gov.sg/e-Services/OneMap.aspx#.VpJjzcZ97IU
EnterpriseOne. (n.d.). BizMap. Retrieved from http://apps.enterpriseone.gov.sg/Bizmap/BizmapEnterpriseone.aspx
Nature Society of Singapore. (n.d.). Bird Watching Locations. Retrieved from http://www.nss.org.sg/wildbirdsingapore/Default.aspx
Public Utilities Board of Singapore. (n.d.). Managing Flash Floods. Retrieved from http://www.pub.gov.sg/managingflashfloods/WLS/Pages/WaterLevelSensors.aspx
Vatsavai, R. R., Burk, T. E., Wilson, B. T., & Shekhar, S. (2000). A Web-based browsing and spatial analysis system for regional natural resource analysis and mapping. Proceedings of the Eighth ACM International Symposium on Advances in Geographic Information Systems - GIS '00.
