Difference between revisions of "ANLY482 AY2017-18T2 Group08 : Project Findings"
Cl.heng.2014 (talk | contribs) m |
Cl.heng.2014 (talk | contribs) |
||
| Line 223: | Line 223: | ||
More specifically however, there are additional things to note. Firstly, the number of entries have now increased to 3041 due to the splitting of rows with multiple addresses. As such, there are more data points now than before. Secondly, ‘Reported Time’, ‘Completed Time’ and ‘Due Time’ have been changed to time format in order to perform appropriate analysis. Thirdly, the ‘# of bikes’ columns have now increased from 12 to 266. This increase comes from the data cleaning process (section 3.1.4), whereby number of bikes were included in the ‘location’ column instead. It is observed that although the increase is significant, a large proportion of the fields are still blanks. Therefore, this column is not used in the current analysis. Lastly, in the original data file, there were some dashes, ‘NA’s and ‘Nulls’. These were all standardised to blanks instead. | More specifically however, there are additional things to note. Firstly, the number of entries have now increased to 3041 due to the splitting of rows with multiple addresses. As such, there are more data points now than before. Secondly, ‘Reported Time’, ‘Completed Time’ and ‘Due Time’ have been changed to time format in order to perform appropriate analysis. Thirdly, the ‘# of bikes’ columns have now increased from 12 to 266. This increase comes from the data cleaning process (section 3.1.4), whereby number of bikes were included in the ‘location’ column instead. It is observed that although the increase is significant, a large proportion of the fields are still blanks. Therefore, this column is not used in the current analysis. Lastly, in the original data file, there were some dashes, ‘NA’s and ‘Nulls’. These were all standardised to blanks instead. | ||
| + | |||
| + | |||
'''<big><font color="#fcb706">5.2 JMP Pro</font></big>''' | '''<big><font color="#fcb706">5.2 JMP Pro</font></big>''' | ||
| Line 250: | Line 252: | ||
<b>5.3.1 LTA Findings </b> <br> | <b>5.3.1 LTA Findings </b> <br> | ||
| − | [[File:Group08_oBike_LTA_Ticket_Issuance.png| | + | [[File:Group08_oBike_LTA_Ticket_Issuance.png|400 px|centre|]] |
<div align="center">Figure 10(a): LTA Ticket Issuance Pattern by Time</div> | <div align="center">Figure 10(a): LTA Ticket Issuance Pattern by Time</div> | ||
| Line 257: | Line 259: | ||
| − | [[File:Group08_oBike_LTA_Ticket_Issuance_by_Time.png| | + | [[File:Group08_oBike_LTA_Ticket_Issuance_by_Time.png|600 px|centre|]] |
<div align="center">Figure 10(b): LTA Ticket Issuance Pattern by Time and Day of Week</div> | <div align="center">Figure 10(b): LTA Ticket Issuance Pattern by Time and Day of Week</div> | ||
| Line 269: | Line 271: | ||
Interestingly, we see that although fewer tickets were issued from the period 9am to 10am as compared to the period between 4pm and 5pm, majority of the overdue tickets come from the former period. On the other hand, the latter period had very few overdue tickets. This phenomenon may be due to the fact that 9am to 10am coincides with the morning peak hour and roads are usually very packed. This means that oBike’s third party contractors are unable to reach the illegally parked bicycles within the stipulated four hours. On the other hand, between 4pm and 5pm, traffic on Singapore roads are usually still smooth as peak hour does not begin until 6.30pm. Consequently, the subcontractors are able to reach the bicycles quickly, thereby avoiding the fines. | Interestingly, we see that although fewer tickets were issued from the period 9am to 10am as compared to the period between 4pm and 5pm, majority of the overdue tickets come from the former period. On the other hand, the latter period had very few overdue tickets. This phenomenon may be due to the fact that 9am to 10am coincides with the morning peak hour and roads are usually very packed. This means that oBike’s third party contractors are unable to reach the illegally parked bicycles within the stipulated four hours. On the other hand, between 4pm and 5pm, traffic on Singapore roads are usually still smooth as peak hour does not begin until 6.30pm. Consequently, the subcontractors are able to reach the bicycles quickly, thereby avoiding the fines. | ||
| − | |||
| − | |||
| − | + | [[File:Group08_oBike_LTA_Overdue_Tix_vs_Total.PNG|600 px|centre|]] | |
| − | <b>4.1. | + | |
| + | |||
| + | <b>5.3.2 Town Council Findings </b> <br> | ||
| + | [[File:Group08_oBike_TC_Tix_Against_Time.png|300 px|centre|]] | ||
| + | <div align="center">Figure 12(a): TC Tickets Against Time</div> | ||
| + | |||
| + | |||
| + | Similarly to LTA, it is observed that TC has a distinct peak in the number of tickets issued from 10am to 12pm as shown in Figure 12(a). However, thereafter, the ticket issuance figures drop drastically. This suggests that TC is most active from 10am to 12pm daily. This would imply that after 12pm, oBike should center their attention and resources onto LTA tickets instead, considering that they currently impose the heaviest fines | ||
| + | |||
| + | |||
| + | [[File:Group08_oBike_MAP_TC_Tix_Issuance.png|500 px|centre|]] | ||
| + | <div align="center">Figure 12(b): Map of TC Ticket Issuance</div> | ||
| + | |||
| + | |||
| + | When TC’s tickets are plotted on a map, see figure 12(b), it becomes obvious that the tickets are issued in concentrated regions in Singapore such as Sengkang, Bedok, Tampines etc. This finding is logical as TCs usually govern a specific area in Singapore. This pattern is therefore useful for oBike as it helps them to discern which areas they should actively target when dealing with TC tickets. A pre-emptive strategy can be undertaken when dealing with TC tickets since it is possible for oBike to predict which areas tend to reel in more tickets. | ||
| + | |||
| + | Besides, from what we have gathered from the last meet up with our sponsor, certain TCs has been actively ramping up their monitoring of illegal parking cases in the region. Therefore, it would benefit oBike greatly if they were able to respond to these illegally parking cases even before the fines become issued. Moreover, given that not all TCs currently impose monetary penalties, oBike can choose to focus their resources on those that do over the rest. | ||
| + | |||
| + | |||
| + | '''<big><font color="#fcb706">5.4 QGIS: Choropleth Map</font></big>''' | ||
| + | |||
| + | <b>5.4.1 General Findings </b> <br> | ||
| + | |||
| + | [[File:Group08_oBike_General_Choropleth_Map.png|500 px|centre|]] | ||
| + | <div align="center">Figure 13: General Choropleth Map</div> | ||
| + | |||
| + | |||
| + | Given that the maps plotted in JMP Pro and Tableau thus far are unable to provide detailed information about the ticket cases, we turned to GQIS to plot a choropleth map instead. Using Singapore’s 2014 master plan, it was then possible to obtain Singapore’s planning boundaries in Singapore. We were then able to plot the map as shown in figure 13 on the left. | ||
| + | |||
| + | |||
| + | [[File:Group08_oBike_Zoomed_In_View_Bedok.jpg|500 px|centre|]] | ||
| + | <div align="center">Figure 14: Zoomed In View of Bedok with Coordinates</div> | ||
| + | |||
| + | |||
| + | The darker areas imply that there are a greater number of bicycles situated therein. Upon more detailed investigation, it is observed that a lot of these data points in the dark blue areas are overlapping. This is consistent with the findings derived from JMP Pro in section 5.2. When we zoom into the dark blue area representing Bedok and click on the middle point (see figure 14), we see that this one point in fact actually represents multiple entries with repeated coordinates. The pop-up window also shows that for Bedok Reservoir, oBike receives multiple complaints per day. In other words, NParks in Bedok tend to be highly active in their enforcement. These conclusions are also consistent with the findings from section 5.3.2. | ||
| + | |||
| + | |||
| + | Currently, since NParks do not impose fines of monetary value, their tickets are lower down on the priority list and therefore, this is somewhat of good news for oBike. Nonetheless, this might pose a huge threat to oBike in the near future if NParks decides to follow suit with the strict imposition of fines instead of just issuing warning letters. | ||
| + | |||
| + | |||
| + | |||
| + | <b>5.3.2 LTA & Town Council Findings </b> <br> | ||
| + | |||
| + | [[File:Group08_oBike_Choropleth_Map_LTA_and_TC_Tix.png|600 px|centre|]] | ||
| + | |||
| + | |||
| + | Comparing figure 15 with 16 above, we see that there is clear difference in the regions where LTA and TC authorities operate in. However, one similarity is that they are both highly active in Bedok regions. Therefore, we have picked Bedok region to be one of the ‘hotspots’. That said, we analysed Bedok further and results show that ticket issuance timings by LTA and TC occur throughout the day, with peaks from 10am to 1pm. Seeing that there are a high number of fines occurring in this region, oBike might wish to consider allocating more manpower to deal with this region. | ||
| + | |||
| + | |||
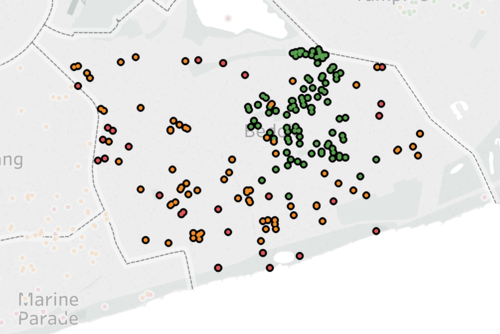
| + | From figure 17, we observe that although the points from TC (in green) are concentrated, the ones from LTA (in red) are more scattered and therefore harder to anticipate. With this in mind, it is perhaps best for oBike to adopt a more preventive approach when it comes to Bedok. If resources permit, they should send more people down to patrol this area and pick up any stray bicycles seen. | ||
| + | |||
| + | |||
| + | |||
| + | [[File:Group08_oBike_Zoomed_in_points_bedok.png|500 px|centre|]] | ||
| + | <div align="center">Figure 17: Zoomed in Points Located in Bedok </div> | ||
| + | |||
| + | |||
| + | |||
| + | '''<big><font color="#fcb706">5.5 Others</font></big>''' | ||
| + | |||
| + | <b>5.5.1 MRT ‘Hotspots’</b> <br> | ||
| + | |||
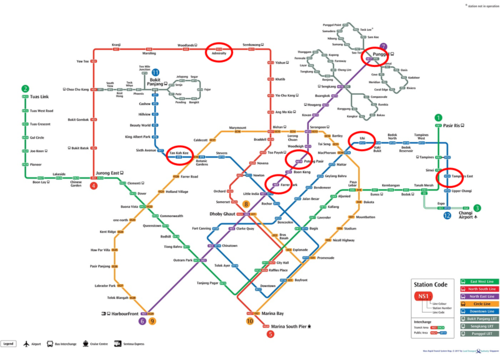
| + | To provide a more wholesome analysis, we have also identified some MRT stations that have repeated and numerous occurrences of illegal parking. These MRT stations include Ubi MRT, Admiralty MRT, Potong Pasir MRT, Punggol MRT, Tampines East MRT and Tan Kah Kee MRT, The findings are illustrated in figure 18 below. | ||
| + | |||
| + | |||
| + | [[File:Group08_oBike_MRT_Map.png|500 px|centre|]] | ||
| + | <div align="center">Figure 18: Illustration of MRT ‘Hotspots’ </div> | ||
| + | |||
| − | + | An interesting finding is that most of the hotspots occur on the lesser-used MRT lines such as the Downtown (blue) and North East (purple) lines. One logical explanation for this is that most MRTs along the North South (red) and East West (green) lines already have yellow boxes in place at stations for users to dock their bicycles. On the other hand, the newer Downtown and less popular North East line have yet to put in place yellow boxes, resulting in a larger number of fines as a result. | |
| − | |||
| − | |||
==<div style="background: #404040; padding: 15px; font-weight: bold; line-height: 0.3em; text-indent: 15px; font-size: 16px"><font color=#ffffff >6.0 Going Forward</font></div>== | ==<div style="background: #404040; padding: 15px; font-weight: bold; line-height: 0.3em; text-indent: 15px; font-size: 16px"><font color=#ffffff >6.0 Going Forward</font></div>== | ||
Revision as of 03:07, 26 February 2018
| Interim | Final |
Contents
1.0 Project Recap
oBike, Singapore’s first home-grown stationless bicycle sharing company, began their operations in January 2017. However, in recent months, Singapore’s Land and Transport Authority (LTA) issued new rules and regulations that require bicycles to be parked in designated yellow boxes around the island. LTA enforcers, together with authorities from Town Council and NParks, survey the island, and issue tickets to bike-sharing companies in the event where bicycles are found to be outside of these yellow boxes. From the time a ticket is issued, oBike has a mere four hours to move their illegally-parked bicycles. Failure to do so will incur hefty fines.
As such, this practicum seeks to achieve the following objectives:- (i) Identify hotspots for illegal parking cases (ii) Project the illegal parking patterns by analysing historical data (iii) Determine suitable areas for yellow boxes to be painted To achieve the above objectives however, we had to first clean the data given and perform exploratory data analysis (EDA). That said, this interim report seeks to document the data cleaning process as well as EDA performed thus far. In addition, any key insights derived till date will also be shared.
2.0 About the Data
The csv files titled ‘Group08_oBike_InterimData’ contains four sheets with descriptions as follows:-
(i) 1.0 Cleaned Data Cleaned data refers to data that has already been cleaned via our data cleaning process, which will be described further in Section 4. The format for ‘1.0 Cleaned Data’ is similar to the original data given by oBike, except there are five newly inserted columns – ‘Original ID’, ‘New ID’, ‘Day’, ‘Updated Addresses’ and ‘Time Period’. This sheet will be used for analysis purposes. Please refer to Figure 1 below for the revised metadata.
(ii) 2.0 Original Data This sheet contains the original, raw data given, with the exception of the row ‘Original ID’ that was inserted for tracking purposes. There is a total of 14 columns in this sheet, inclusive of ‘Original ID.’ Please refer to Figure 1 below for the revised metadata. (iii) 3.0 Appendix & Notes The purpose of this sheet is to highlight to any reader on the changes made to the original data set to allow for better comprehension of the data cleaning process. It contains notes relating to data points that were duplicated or removed.
(iv) 3.1 Cross Checking This sheet is used internally for our cross checking between ‘1.0 Cleaned Data’ and ‘2.0 Original Data’ to ensure that no error occurred when duplicating the data. Using the ‘LOCATION’ column which contains all unique entries of addresses, we cross checked to ensure that all the entries in the ‘1.0 Cleaned Data’ are found in the ‘2.0 Original Data’ and vice versa.
2.1 Revised Metadata
2.2 Summary Statistics for '1.0 Original Data'
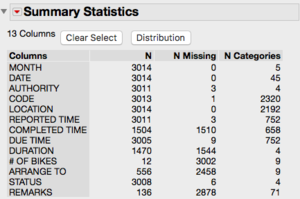
As shown in figure 2 above, although there is a total of 3,014 rows present, a significant number of rows had missing fields. In particular, four columns had a strikingly high number of blanks – ‘Completed Time’, ‘Duration’, ‘# of Bikes’ and ‘Arrange To. Of these, the ‘# of Bikes’ column had the highest percentage of blanks i.e. 99.6%. Reasons and consequences of such blanks will be further discussed in section 3.0 below.
3.0 Data Quality Issues & Consequences
This section will elaborate in detail the data quality issues faced by the team, as well as the consequences and limitations resulting from these issues. In sum, the data quality issues faced by the team can be broken down into five broad categories – Addresses, No. of Bikes, Authority, Status and General/Miscellaneous.
3.1 Original Address / Location
Although the ‘Original Address’ column had zero blanks, it was plagued with numerous data quality issues which severely hindered our data cleaning process.
3.1.1 Vague Descriptions
Many entries contained extremely vague descriptions of locations located in Singapore. Such vague locations would render it impossible
to plot an accurate location of the illegal parking cases on a map. Vague descriptions inevitably mean that Google API will return pre-
pinned longitude and latitude coordinates for such cases. In other words, Google API returns the exact same geographical coordinates
even if the actual location of the bicycles were different. Consequently, when translating these coordinates onto a map, these points
will overlap/combine into one distinct point, which is visually misleading to the user.
For instance, ‘East Coast Park’ is a beach park stretching from Marina East to Bedok planning areas in Singapore and covers 185 hectares of land. Therefore, tickets could have been issued anywhere in this area between Marina East Drive and Water Venture Coast (see Figure 3 above for visual representation). However, feeding the location ‘East Coast Park Singapore’ to Google API will only generate longitude and latitude coordinates of 103.9121866 and 1.3007842 respectively. This means that vague descriptions have an inherently high margin of error. Therefore, vague descriptions restrict our ability to derive meaningful insights from analysis. Other vague descriptions include but are not limited to ‘Bedok Reservoir’, ‘Coney Island’, ‘Bishan-Ang Mo Kio Park’, and ‘Whole stretch of Admiralty Street’.
Further, from an operational perspective, the more specific the location, the easier and faster it will be for oBike to track down the bicycles for redeployment.
Further, from an operational perspective, the more specific the location, the easier and faster it will be for oBike to track down the bicycles for redeployment.
3.1.2 Overly Specific Descriptions
In stark contrast to the above, there are also descriptions of locations which are overly specific. Overly specific descriptions hinders the efficiency and ability of Google API to return an accurate geographical coordinate. For example, although descriptions such as ‘Left at rubbish chute 4 and behind washing bay of Blk 227 Serangoon Ave 4’ may be useful in helping oBike find illegally parked bicycles, feeding such lengthy descriptions to Google API interferes with its ability to pick up keywords, so chances are, it may return zero results. In other cases, Google API may pick up the wrong keywords and therefore return inaccurate geographical coordinates.
3.1.3 Multiple Locations
Some of the ‘location’ fields contain not one, but multiple addresses. In most cases, the addresses are in proximity to one another. For instance, although there are three distinct locations in the description ‘Blk 713, 714 and 716 Pasir Ris Drive 3’, these locations are adjacent to one another. In other instances such as ‘Swettenham Road / Ridout Road / Peel Road / Peirce Road’, the locations are situated on different roads that are further apart. Most times, if Google API receives more than one location, it will simply return the geographical coordinates of the first. In the case of the former, where multiple locations are adjacent to one another, this does not pose much of a problem as the longitude and latitude coordinates are still somewhat accurate. Put simply, Blk 713 Pasir Ris Drive 3’s geographical coordinates are similar to that of Blk 714 and 716 due to the close proximity of the locations. However, for the latter case, if Google API were to only return me the coordinates of the first location i.e. Swettenham Road, this coordinates may differ significantly from the remaining locations (Pierce Road), thereby returning unrepresentative results.
3.1.4 Junctions
Some of the addresses provided refer to junction between roads, with no particular landmark given. Such locations are recorded in the following format ‘Junction between Road X and Road Y’. For a handful of these entries, Google API is able to recognise the term ‘junction’ and therefore returns the coordinates of the junction between roads. However, it is noticed that its ability to do so is largely inconsistent. Most times, Google API picks up only the first road name, and returns the pre-pinned coordinates for that particular road. Thus, the outputs of Google API will contain erroneous results if fed such entries without first cleaning them.
3.1.5 Spelling Errors & Acronyms
It was also apparent that some of the entries contained spelling errors due to human error. For instance, ‘Bedok Reservoir’ was misspelled as ‘Bedok Resevoir’ and ‘Buona Vista’ was spelt as ‘Buana Vista’. Although Google API was still able to still detect the locations for some of these descriptions, the output was usually inconsistent, thereby raising the occurrences of inaccurate outputs. Additionally, several entries contained acronyms such as ‘ECP’ and ‘CCK’, which stands for East Coast Park and Choa Chu Kang respectively. Although these terms are commonly used by Singaporeans to identify locations, Google API is unable to recognise majority of such terms and therefore will not return any geographical coordinates. In addition, less commonly used acronyms were also used, such as ‘BNA’, ‘MSCP’, ‘PRP’, which stands for Bedok North Avenue, Multi-storey Carpark, and Pasir Ris Park respectively. For such terms, data cleaning was absolutely necessary in order to retrieve the latitude and longitude coordinates.
3.2 Number of Bikes
As seen in Figure 2, the ‘# of bikes’ column had the highest absolute number and percentage of blanks. Upon closer look, it was observed that for some entries, the number of bikes were given, but was recorded in the ‘location’ column together with the addresses instead. Nevertheless, for majority of the entries, information regarding the number of bicycles were indeed missing. The rationale behind this is that authorities issuing the fines almost never notify bicycle-sharing companies such as oBike about the number of bicycles present in a location. Accordingly, on oBike’s end, they are unable to record information which they do not possess. Authorities claim there are frequently too many bicycles in given location by all three operators – Ofo, Mobike and oBike – so it becomes too time consuming to manually count the number of bicycles belonging to each company.
Admittedly, however, this information is crucial from a business standpoint. As the bicycles are currently fined on a per bike basis, the number of bicycles determines the monetary value of the fines and therefore, would govern the operations pertaining to oBike’s bicycle redeployment strategy. On our part too, it is impossible to accurately predict ‘hotspots’ in terms of the dollar amount of fines oBike is receiving. This lack of information is considered a severe limitation of this project. For instance, theoretically, if oBike receives two fines simultaneously – Clementi (30 bikes) and Ang Mo Kio (1 bike), it makes more business sense for them to assign their limited resources to address the ticket containing more bicycles first i.e. Clementi, as the value of fines would be $15,000 and $500 respectively. Without knowing the number of bikes in each ticket, oBike would be lacking key information. In other words, they are currently assigning their limited resources blindly.
3.3 Authority
Although this column was mostly filled up, three entries remained blanks. One of them had a high number of bicycles (80) in the ticket issued. Interestingly, it was also noted that apart from ‘LTA’, ‘NParks’ and ‘TC’, there was also another category labelled as ‘Others’ that contained only one entry. As the value of fines vary depending on the authority who issues it e.g. LTA fines $500 per bike while NParks does not yet issue fines, the authority field is also important as it determines the urgency of responding to fines. The higher the potential amount of fines, the more urgent the ticket becomes.
3.4 Status
Status typically falls in one of the following categories – ‘ignore’, ‘arranging’ and ‘completed’. Despite the low percentage of blanks for this column, it is observed that 995 out of 3039 entries (32.74%) are classified as ‘arranging’. This suggests that oBike does not consistently update the status of the ticket response. Accordingly, it is difficult to draw insights on the efficiency of their third party contractors.
3.5 Codes
Codes are meant to enable oBike to uniquely identify each ticket received. However, for this dataset, the code is not unique. As shown in figure 2 above, there a 3013 instances of codes, but only 2320 categories. This suggests that some codes are not unique. A unique identifier helps to trace the progress and response of each ticket. For LTA tickets, the codes do represent a unique identifier. However, for tickets issued by NParks and Town Council, the codes are not unique. For one, codes for tickets by TC only represent an area which is governed by a particular town council e.g. ‘Clementi’, ‘Woodland’, ‘AMKTC’. These codes have multiple entries under them, making it difficult to track individual ticket cases due to the lack of a unique identifier.
4.0 Data Cleaning & Preparation
In light of the aforementioned data quality issues, data cleaning had to be undertaken to minimise the negative consequences that may arise. This section elaborates further on the steps taken during the data cleaning and preparation process.
4.1 Manual Cleaning of Addresses
Considering that the location field posed numerous data quality issues, coupled with the fact that Google API requires the location field to be in a relatively neat and standardised format, several measures had to be taken to tidy up the locations.
4.1.1 Adding Singapore
Some road names and landmarks in Singapore have similar names to other locations in other countries, e.g. Arthur Road can not only be found in Singapore but also in the UK and India. That said, it is important to add the term ‘Singapore’ behind each location to ensure that the output received relates to a distinct place in Singapore, and not elsewhere.
4.1.2 Correcting Acronyms and Spelling Errors
For descriptions containing acronyms and spelling errors, we had to correct them accordingly. For instance, ‘Blk 628 HG Ave 8’ would have to be changed to ‘Blk 628 Hougang Ave 8’. Via the excel find and replace function, this could be done to multiple entries at once, thereby speeding up the process.
4.1.3 Splitting Multiple Locations
For entries with multiple addresses, it was necessary to split them into individual locations depending on how far apart these locations are. For instance, with reference to Figure 4 below, there are three locations captured in a single entry – Springwood Crescent, Springwood Avenue and Jalan Mat Jambol. However, as Springwood Crescent and Springwood Avenue and streets adjacent to each other, they are kept together as a single entry. On the other hand, Jalan Mat Jambol is further away and hence, requires us to split the entry into two. Consequently, one entry with three distinct locations are split into two.
To ensure consistent splitting of entries, an arbitrary benchmark was set at three decimal places in the longitude or latitude coordinates. In other words, if the third decimal place of the longitude and latitude coordinates differ, then the entries are split up. Differences in the third decimal place for longitude and latitude coordinates means that the locations are more than 110m apart in radius. However, the data currently still requires further refinement as not all points are yet consistent with this benchmark.
4.1.4 Removing Excessive Descriptions
Since excessive descriptions interfere with Google API’s ability to produce accurate outputs, they have to be manually removed from the location fields. For instance, ‘Bus stop 11531. Alexandra. Near IKEA region. Pls remove these asap and report back to me when it is done’ will simply be changed to ‘Bus stop 11531 Singapore’. Otherwise, Google API may pick up the keyword ‘IKEA’ and return the coordinates for ‘IKEA Tampines’ instead. Removing excessive descriptions helps to improve both the efficiency and accuracy of Google API. In addition, it was noticed that in some entries, authorities did provide information regarding the number of bikes, but this information was recorded in the ‘location’ column instead – e.g. ‘2 oBike infront 368 Thomson Condo along Jalan Raja Udang’. For such rows, we would delete the excess descriptions, and insert the number of bikes into the ‘# of bikes’ column instead. Put simply, we will manually fill in the ‘# of bikes’ in the event where information is provided.
4.1.5 Pinning Junctions
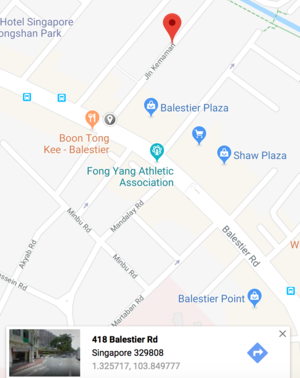
To resolve the inherent problems involved with feeding junctions between two roads to Google API as discussed in section 3.1.4, we first had to filter out addresses containing the keyword ‘junction’. One of such locations would be ‘Junction of Balestier Rd and Jln Kemaman’. Using the road names, we would then use google maps on web browser to produce an image as shown by Figure 5 above.
From the image, it is then possible to visualise the junction between the roads. Following which, we will manually pin the location as shown in figure 5. Doing so will return the latitude and longitude coordinates; in this case they are 1.325717 and 103.849777 respectively.
Having these coordinates, we will then input them into the csv file accordingly. Although there are still flaws present with this method i.e. pinning in slightly to the left or right will produce different coordinates, it is nonetheless still more accurate than simply allowing Google API to generate the geographical coordinates. Hence, the accuracy is still improved.
4.1.6 No Landmark Locations
Due to the nature of the point to point transport, some bicycles are parked in areas with no specific landmarks, or are located between landmarks. For instance, ‘between Blk 126 and Blk 124 Simei Street’ implies that the bicycle was neither parked at Blk 126 or 124, but instead was found somewhere between these blocks. For such cases, we follow the method described above (section 4.1.5) to check if there is indeed no landmark present. If so, we will then simply take the first address recorded i.e. Blk 126 Simei Street.
4.1.7 Vague Descriptions
As mentioned, vague descriptions result in inaccurate and sometimes even misleading results. However, due to the lack of information and nature of the data issue, it is impossible to have improve the current descriptions unless authorities decide to be more specific with their descriptions. Ergo, there is nothing that can be done short of asking oBike to request for better quality descriptions. Such locations are simply fed to Google API to obtain the pre-pinned geographical coordinates.
4.2 Bus Stop Codes
As bus stops codes represent unique identifiers for bus stops around Singapore, it is possible to get very specific longitude and latitude coordinates directly from LTA Data Mall. The rationale for using LTA’s data mall over Google API is that the former contains the most updated and relevant information in Singapore, and should therefore produce better quality outputs. An R-code is the used to speed up the process of retrieving the geographical coordinates for all bus stop locations. Please refer to Appendix Section 8.1 for the r-script used.
4.3 Geocoding with Google API
For the remaining of the data points with no geographical coordinates obtained, an r-script was ran via rStudio to retrieve the longitude and latitude values. However, it was noticed that even after cleaning up the data, many of the entries still returned ‘NA’ as output. Moreover, it was noted that even specific addresses with postal codes could result in a ‘NA’ output (refer to figure 6 for a screenshot of the raw output by Google API). This was in fact due to a problem inherent with Google API. Without a commercial license, Google API has a query limit that prevents it from retrieving the coordinates. Therefore, the r-script was revised to include a loop such that if the output is ‘NA’, it will re-run the same entry three more times. This revision greatly improved the efficiency of the code. Refer to Appendix Section 8.2 and 8.3 for the original and revised geocode r-scripts.
4.4 Reverse Geocoding
Lastly, as a checking step, an r-script containing a reverse geocode was used. The reverse geocode works by taking the longitude and latitude coordinates generated by Google API to produce an address. Since each longitude and latitude is certain to have a corresponding address, the r-script was written to loop until the an address is returned. This address was then checked with the original location to ensure that it matches. This steps is to try and reduce the inconsistencies present in Google API. Refer to Appendix Section 8.4 for the reverse geocode r-script.
5.0 Exploratory Data Analysis and Interim Findings
5.1 Revised Summary Statistics
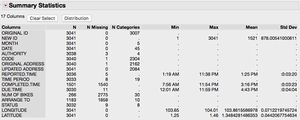
After data cleaning and preparation, summary statistics was once again ran to get an overview of the cleaned data. This is shown in Figure 7 below.
In comparison to the summary statistics performed on the original data set given by oBike (see figure 2), it should be noted that the cleaned data set now has 17 columns instead of the original 13 columns. Some column titles have been edited e.g. ‘Location’ is now referred to as ‘Original Address’. Columns that have been omitted include ‘remarks’, while new columns inserted include ‘Original ID’, ‘New ID’, ‘Updated Address’, ‘Time Period’, Longitude’ and ‘Latitude’.
More specifically however, there are additional things to note. Firstly, the number of entries have now increased to 3041 due to the splitting of rows with multiple addresses. As such, there are more data points now than before. Secondly, ‘Reported Time’, ‘Completed Time’ and ‘Due Time’ have been changed to time format in order to perform appropriate analysis. Thirdly, the ‘# of bikes’ columns have now increased from 12 to 266. This increase comes from the data cleaning process (section 3.1.4), whereby number of bikes were included in the ‘location’ column instead. It is observed that although the increase is significant, a large proportion of the fields are still blanks. Therefore, this column is not used in the current analysis. Lastly, in the original data file, there were some dashes, ‘NA’s and ‘Nulls’. These were all standardised to blanks instead.
5.2 JMP Pro
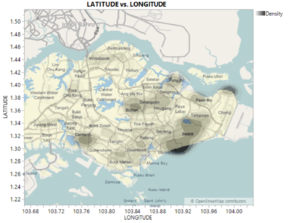
In the initial stages of analysis, our team played around with JMP Pro’s map function to visualise the spread of illegally parked bicycles around Singapore. The resulting contour map is shown below in figure 8. As can be seen, however, the map had several limitations. For one, is a static one i.e. it is not interactive and does not provide specific information when the points are clicked on. Furthermore, the map in JMP Pro does not show the respective areas in Singapore e.g. ‘Ang Mo Kio’ or ‘Bedok’. Consequently, we had to find an image of Singapore’s planning boundaries and superimpose it onto JMP’s given map. Lastly, although the heat map is somewhat able to give an idea of where the most cases of illegal parking occurs, it does not provide us with a count function. Hence, it is impossible to derive the specific number of tickets issued in one case.
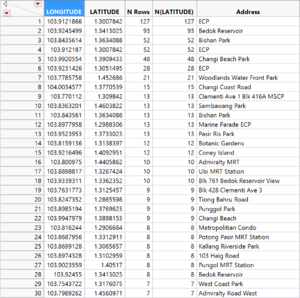
Also, JMP Pro provides additional insights as it shows that a large number of points were repeated due to vague locations. With reference to figure 9, we know that there are a total of 207 entries belonging ‘ECP’, of which 127 of them have the exact same coordinates, implying that these were the pre-pinned location resulting from Google API. Besides ECP, other notable points are Bedok Reservoir, Bishan Park and Changi Beach Park with 93, 52 and 48 points respectively.
It is interesting to note that most of these vague descriptions refer to parks and reservoirs and are tickets issued mostly by NParks.
5.3 Tableau
In an attempt to identify ticket issuance patterns by LTA, we utilised Tableau to help plot graphs and charts for easy visualisation purposes. Some key findings are shown in the figures below.
5.3.1 LTA Findings
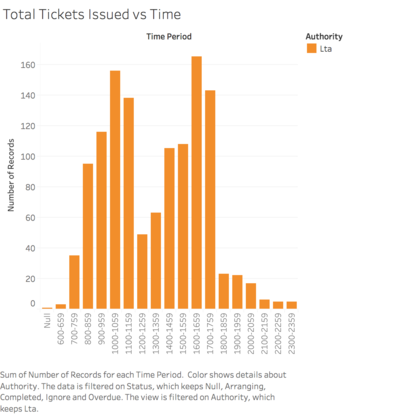
As shown in figure 10(a), LTA ticket issuance peaks at two distinct time periods, 10am to 12pm and 4pm to 6pm. The first peak could be a result of the morning rush hour whereby bicycle users leave their bicycles all around the island while en route to school/work. The second spike in LTA ticket issuance may be due to oBike purposefully unloading bicycles in areas such bus stops and MRTs in anticipation of the evening rush hour. This leads to a sharp increase in the number of tickets issued. It is also interesting to note that between 12pm to 2pm, there is a significant dip in the numbers, perhaps due to it being lunch period.
After breaking this down further into day of week, as seen in figure 10(b) above, it is observed that these findings are consistent throughout all weekdays, with the highest number of fines occurring on Tuesday. On weekends, we see that the number of fines are much lesser, which is to be expected as most LTA officers would rest over the weekends. Nevertheless, given that oBike currently only have arrangements for redeployment on weekdays, they should start to prepare themselves for the future in the event whereby LTA were to step up their monitoring on weekends.
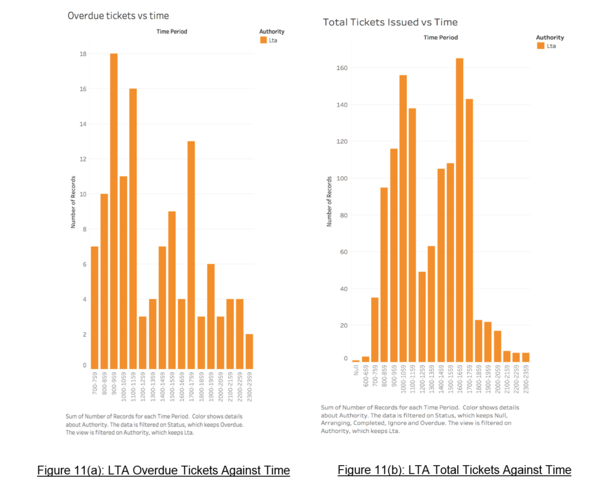
To derive insights with regard to oBike’s efficiency in responding to these tickets issued by LTA, we plot the number of overdue tickets with respect to time, as shown in figure 11(a) below. This chart is then compared to figure 11(b), which represents the total number of records against time.
Interestingly, we see that although fewer tickets were issued from the period 9am to 10am as compared to the period between 4pm and 5pm, majority of the overdue tickets come from the former period. On the other hand, the latter period had very few overdue tickets. This phenomenon may be due to the fact that 9am to 10am coincides with the morning peak hour and roads are usually very packed. This means that oBike’s third party contractors are unable to reach the illegally parked bicycles within the stipulated four hours. On the other hand, between 4pm and 5pm, traffic on Singapore roads are usually still smooth as peak hour does not begin until 6.30pm. Consequently, the subcontractors are able to reach the bicycles quickly, thereby avoiding the fines.
5.3.2 Town Council Findings
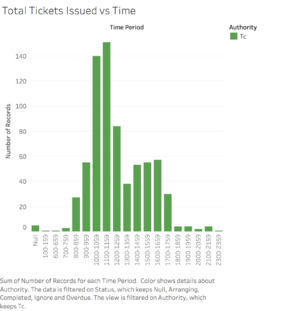
Similarly to LTA, it is observed that TC has a distinct peak in the number of tickets issued from 10am to 12pm as shown in Figure 12(a). However, thereafter, the ticket issuance figures drop drastically. This suggests that TC is most active from 10am to 12pm daily. This would imply that after 12pm, oBike should center their attention and resources onto LTA tickets instead, considering that they currently impose the heaviest fines
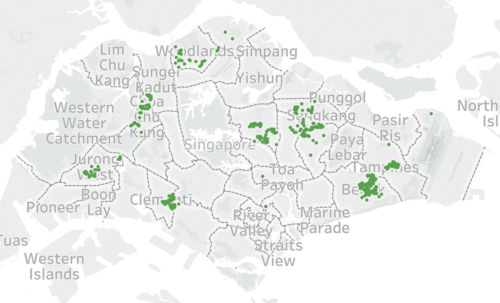
When TC’s tickets are plotted on a map, see figure 12(b), it becomes obvious that the tickets are issued in concentrated regions in Singapore such as Sengkang, Bedok, Tampines etc. This finding is logical as TCs usually govern a specific area in Singapore. This pattern is therefore useful for oBike as it helps them to discern which areas they should actively target when dealing with TC tickets. A pre-emptive strategy can be undertaken when dealing with TC tickets since it is possible for oBike to predict which areas tend to reel in more tickets.
Besides, from what we have gathered from the last meet up with our sponsor, certain TCs has been actively ramping up their monitoring of illegal parking cases in the region. Therefore, it would benefit oBike greatly if they were able to respond to these illegally parking cases even before the fines become issued. Moreover, given that not all TCs currently impose monetary penalties, oBike can choose to focus their resources on those that do over the rest.
5.4 QGIS: Choropleth Map
5.4.1 General Findings
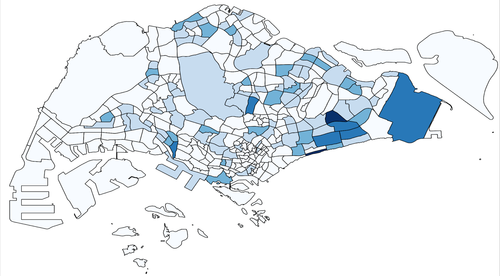
Given that the maps plotted in JMP Pro and Tableau thus far are unable to provide detailed information about the ticket cases, we turned to GQIS to plot a choropleth map instead. Using Singapore’s 2014 master plan, it was then possible to obtain Singapore’s planning boundaries in Singapore. We were then able to plot the map as shown in figure 13 on the left.
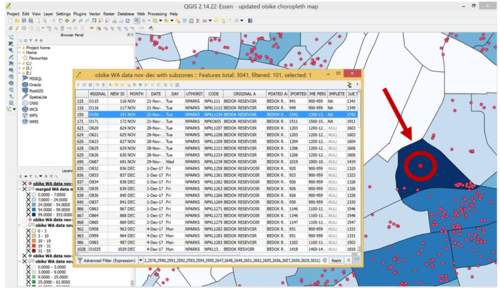
The darker areas imply that there are a greater number of bicycles situated therein. Upon more detailed investigation, it is observed that a lot of these data points in the dark blue areas are overlapping. This is consistent with the findings derived from JMP Pro in section 5.2. When we zoom into the dark blue area representing Bedok and click on the middle point (see figure 14), we see that this one point in fact actually represents multiple entries with repeated coordinates. The pop-up window also shows that for Bedok Reservoir, oBike receives multiple complaints per day. In other words, NParks in Bedok tend to be highly active in their enforcement. These conclusions are also consistent with the findings from section 5.3.2.
Currently, since NParks do not impose fines of monetary value, their tickets are lower down on the priority list and therefore, this is somewhat of good news for oBike. Nonetheless, this might pose a huge threat to oBike in the near future if NParks decides to follow suit with the strict imposition of fines instead of just issuing warning letters.
5.3.2 LTA & Town Council Findings
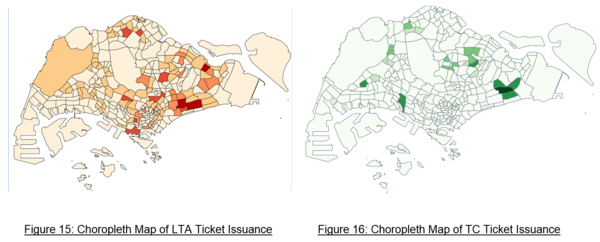
Comparing figure 15 with 16 above, we see that there is clear difference in the regions where LTA and TC authorities operate in. However, one similarity is that they are both highly active in Bedok regions. Therefore, we have picked Bedok region to be one of the ‘hotspots’. That said, we analysed Bedok further and results show that ticket issuance timings by LTA and TC occur throughout the day, with peaks from 10am to 1pm. Seeing that there are a high number of fines occurring in this region, oBike might wish to consider allocating more manpower to deal with this region.
From figure 17, we observe that although the points from TC (in green) are concentrated, the ones from LTA (in red) are more scattered and therefore harder to anticipate. With this in mind, it is perhaps best for oBike to adopt a more preventive approach when it comes to Bedok. If resources permit, they should send more people down to patrol this area and pick up any stray bicycles seen.
5.5 Others
5.5.1 MRT ‘Hotspots’
To provide a more wholesome analysis, we have also identified some MRT stations that have repeated and numerous occurrences of illegal parking. These MRT stations include Ubi MRT, Admiralty MRT, Potong Pasir MRT, Punggol MRT, Tampines East MRT and Tan Kah Kee MRT, The findings are illustrated in figure 18 below.
An interesting finding is that most of the hotspots occur on the lesser-used MRT lines such as the Downtown (blue) and North East (purple) lines. One logical explanation for this is that most MRTs along the North South (red) and East West (green) lines already have yellow boxes in place at stations for users to dock their bicycles. On the other hand, the newer Downtown and less popular North East line have yet to put in place yellow boxes, resulting in a larger number of fines as a result.
6.0 Going Forward
7.0 Conclusion
