Difference between revisions of "Group04 Interim"
| Line 222: | Line 222: | ||
===== <u>Summary</u> ===== | ===== <u>Summary</u> ===== | ||
| − | A summary of insights derived from analysis of | + | A summary of insights derived from analysis of net likes can be seen below: |
* Night Owl Cinematics have the highest average net like count while SGAG has the lowest. | * Night Owl Cinematics have the highest average net like count while SGAG has the lowest. | ||
* In terms of total net like count share, Night Owl Cinematics has the majority share but its percentage share has been steadily declining since 2014. The Smart Local has been increasing rapid whereas SGAG has increased slightly and has been the lowest consistently. | * In terms of total net like count share, Night Owl Cinematics has the majority share but its percentage share has been steadily declining since 2014. The Smart Local has been increasing rapid whereas SGAG has increased slightly and has been the lowest consistently. | ||
Revision as of 10:00, 19 February 2018
| GROUP4 |
| PROPOSAL | FINAL |
|---|
Contents
Data Preparation
YouTube Posts
To help SGAG conduct a comprehensive competitor analysis on YouTube, we scraped all metal data from Night Owl Cinematic, TheSmartLocal and SGAG’s YouTube channels using YouTube-DL into .json files. Using Python, we parsed the necessary data into a csv format before importing the data into JMP Pro.
Removing Outliers
View Counts
After which, we removed outliers based off view counts as view count is the only indicator of a viral YouTube video. It is also important to note that we removed such outliers by channel as each channel would have different levels of average performances. We did this using JMP Pro's Quantile Range Outliers analysis, using the default tail quantile of 0.1 and Q scaling factor of 3. The table below shows examples of outliers:
As mentioned in the proposal report, the Pokemon Go prank was a viral video as it was a prank carried out during the Pokemon Go craze by the SGAG team who tricked the public crowd into thinking there is a Snorlax nearby, when there was none.
Published Date
To ensure a fair comparison in terms of time frame, we would be filtering the data to only include videos published after 15 October 2014. This is as the first SGAG YouTube video was published in 15 October 2014.
The table below summaries the new number of data points after removing such outliers:
Creating New Variable
We created the following new variable that may be used for analysis:
Updated Metadata Table
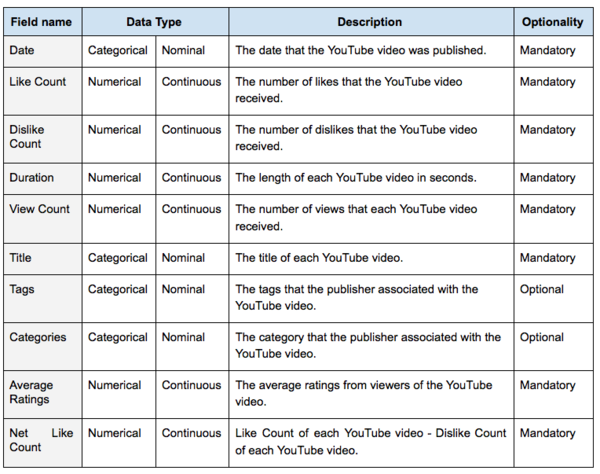
Below is the final metadata of the data we have transformed and cleaned.
Exploratory Data Analysis
We would be outlining the main findings and charts in the section below. Please look at the report for a detailed insight into the methodologies utilised.
Objective 3: Competitor Analysis
Overview EDA of YouTube Video Posts
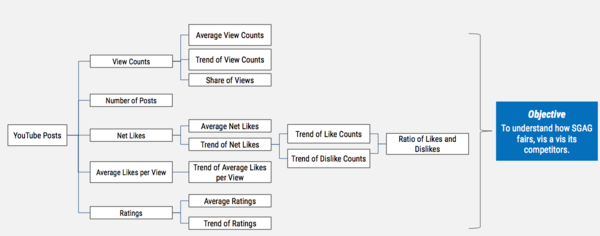
The graph below showcases the various analysis that we would be performing and its associated objectives.
It is also important to note that we would be looking at each and every performance indicator (View Counts, Net Likes and Ratings) as they are not highly correlated with each other. In addition, the table below showcases the key indicators of SGAG.
View Counts
View counts are used to judge the performance of each YouTube video. By analyzing view counts, we are able to understand the performance SGAG, vis a vis its competitors. We would also look at the trends and view share of each channel to understand what SGAG can do to perform better at a macro level.
Average View Count
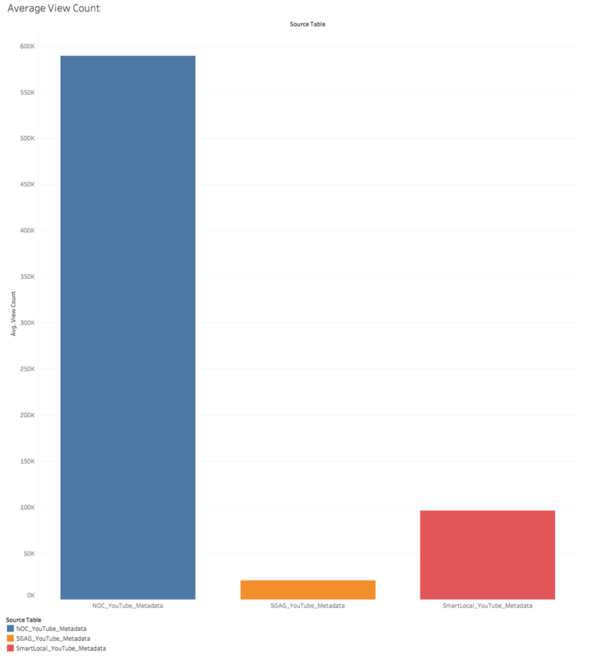
As seen in the image below, Night Owl Cinematics is the clear leader in terms of average view counts whereas SGAG lags far behind. It is important to note that they are all statistically different from each other at a 95% confidence interval.
Overall View Count Trends
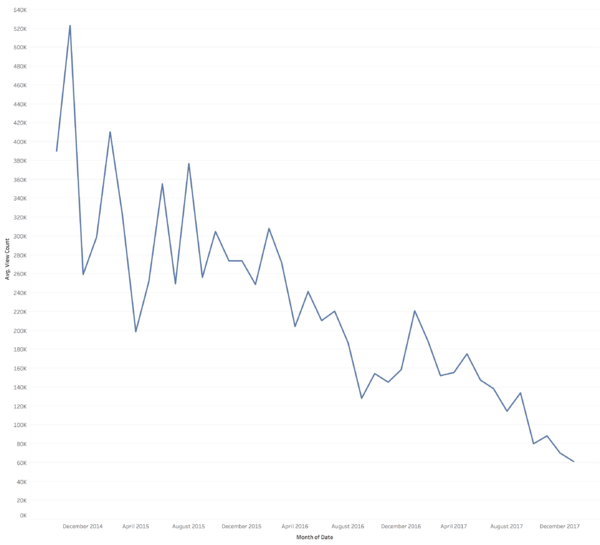
As seen in the graph, there seems to be a general declining trend in terms of average view counts. A confirmatory analysis in the form of a correlation analysis was performed and this was confirmed. The correlation coefficient is at -0.24. This declining trend started consistently post 2015.
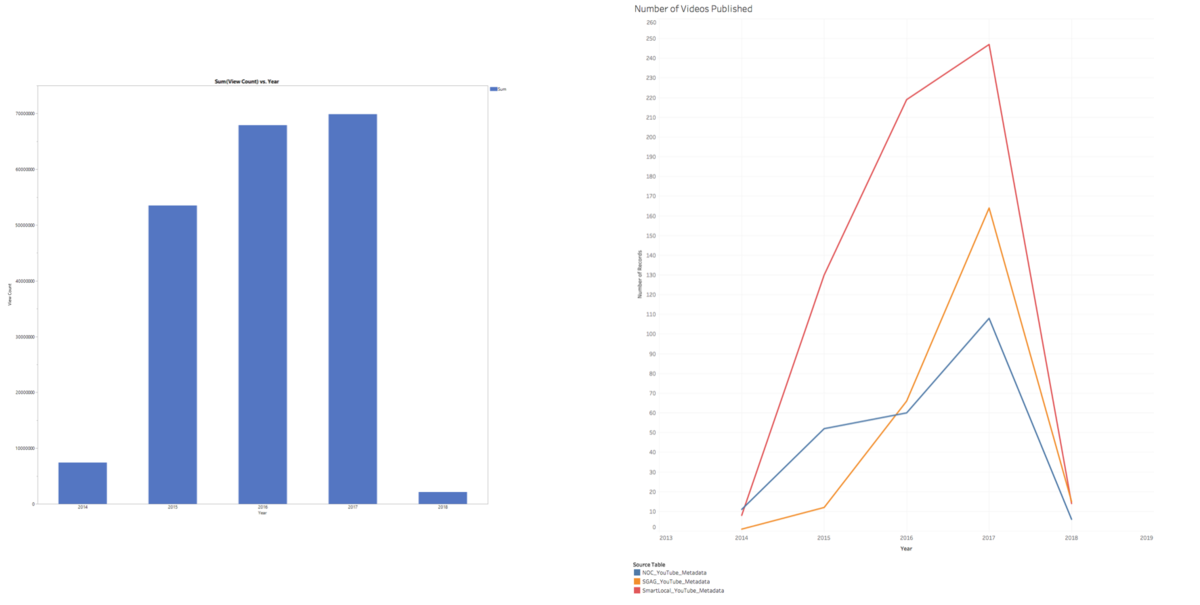
However, the total view counts have been increasing since 2014. That being said, the average view counts have been decreasing as the number of videos published have been increasing consistently since 2014. These can be in seen in the graph below.
In other words, viewers are not watching every single video published and each channel is producing more varied content that appeals to different customer segments.
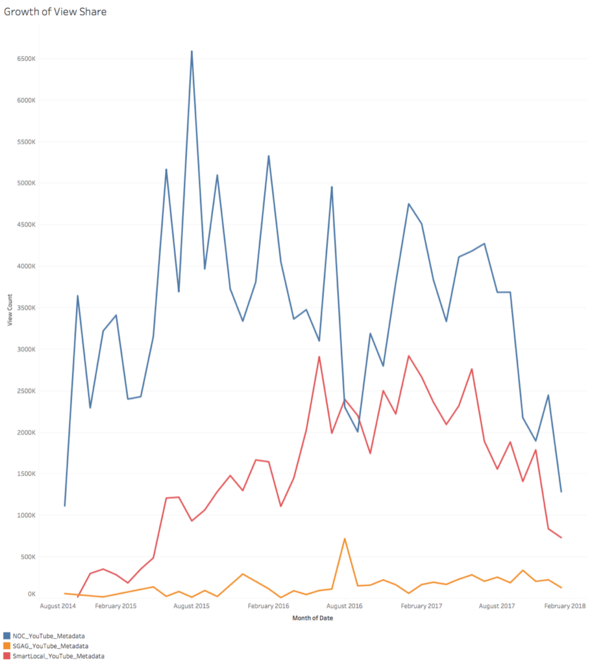
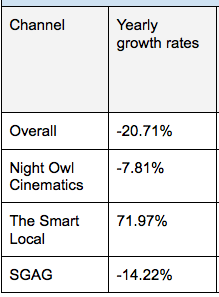
As seen in the graph above, The Smart Local's view counts have been growing at the fastest rate, relative to its competitors.
As seen in the table above, Night Owl Cinematics' average view count has been decreasing faster than the whole industry whereas The Smart Local's average view count has been decreasing on par with the industry. This trend started in 2016, implying that SGAG needs to break away from the norm that the other channels have established over the years. In short, emulating Night Owl Cinematics and The Smart Local entirely would not lead to better outcomes in the long run. It is clear that their current video format and content would not help SGAG become the dominant player in the near future.
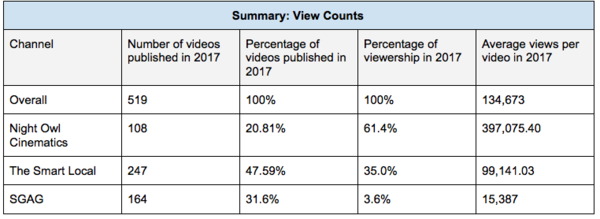
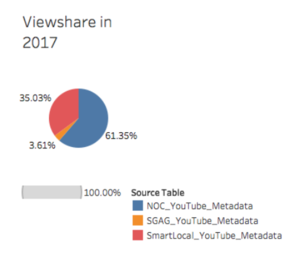
As the average view counts for each channel are statistically different from each other at a 95% confidence interview, we are able to compare across channels. As seen in the graph below, in 2017, SGAG published 31.6% of videos but only obtains a low 3.6% in terms of share of view counts.
In short, the quantity of videos published is not the driving factor of video performance. This can be best exemplified by Night Owl Cinematics, whereby it accounts for the least number of videos published but the majority of viewshare in 2017.
Summary
A summary of insights derived from analysis of view counts can be seen below:
- Night Owl Cinematics have the highest average view counts and SGAG has the lowest.
- Since 2015, average view counts of all channels are declining over time.
- The number of videos published are increasing for each channel over time.
- Total view count is increasing for each channel.
- Night Owl Cinematic’s share of viewership has been decreasing since 2015 and The Smart Local and SGAG’s share of viewership has been increasing since 2015. The Smart Local’s share of viewership has been increasing much more rapidly than SGAG.
- SGAG published 31.6% of videos in 2017 but only accounts for 3.6% of viewership. In contrast, Night Owl Cinematics published the least number of videos in 2017 but accounts for the majority of viewership.
- Night Owl Cinematics’ average view counts are declining at a faster rate than industry and has been starting since 2016.
- The Smart Local’s average view counts are declining as fast as the industry and has been starting since 2016.
Collectively, it implies that:
- Viewers are not watching every single video published and that each channel is producing varied content that appeals to different customer segments.
- The quality and not quantity of videos published matters.
- Night Owl Cinematics is the clear leader in terms of view counts but The Smart Local is the leader in terms of growth.
- SGAG have to break away from the norm that the other channels have established over the years as viewer fatigue has clearly set in. SGAG needs to reinvent their content in order to break this declining trend.
- Emulating Night Owl Cinematics and The Smart Local entirely would not lead to better outcomes in the long run. With a correlation coefficient of -0.43 (Night Owl Cinematics), it is indeed clear that their video format and content would no longer work in the near future, in that it would not guarantee that SGAG becomes the market leader.
Net Likes
Net likes are another indicator that can be used to judge the performance of each YouTube video. This is as an extremely unpopular video can go viral and obtain a huge number of view counts too. Hence, Net Likes shows exactly how desirable each video is perceived by its users. This would be a leading indicator as users would only click and view videos that are perceived as being desirable.
Overall Average Net Likes
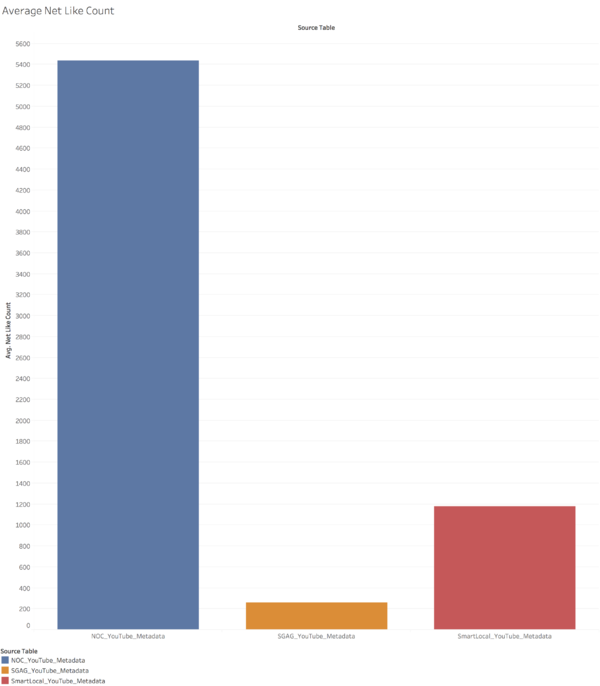
As seen in the graph, SGAG has the lowest average net likes whereas Night Owl Cinematics have the highest average net likes. This difference is statistically significant at a 95% confidence interval.
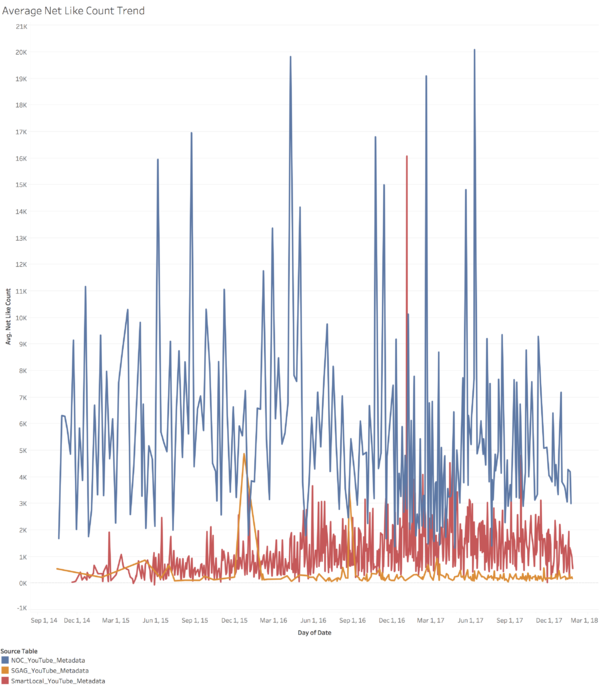
Average Net Likes Trend
As seen in the graph, there seems to be a general slight declining trend in terms of average view counts. A confirmatory analysis in the form of a correlation analysis was performed and this was confirmed. The correlation coefficient is at -0.08.
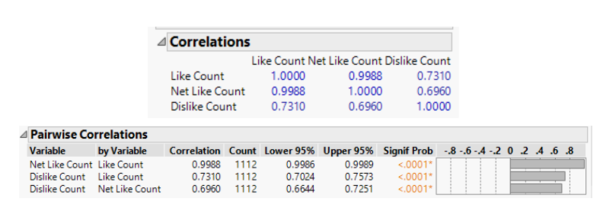
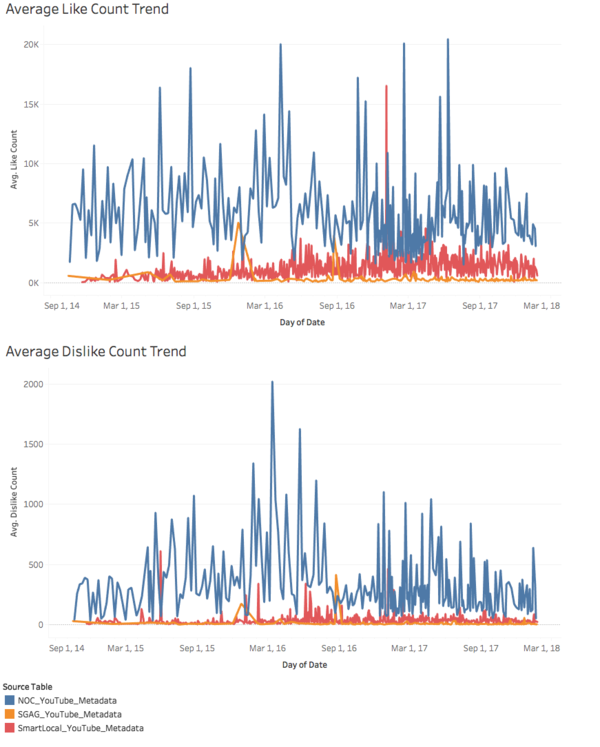
To better understand the source of this trend, we then split the number of net likes into likes and dislikes. As seen in the table below, the like and dislike count are positively correlated with the net like count, with the like count being highly correlated (0.9988) with net like count and dislike count being moderately correlated with net like count (0.696). These insights were derived from a correlation analysis at a 95% confidence interval. This implies that the main driving force behind the decreasing trend in net like count comes from the decrease in like count, relative to dislike count.
A graphical representation of these trends can be seen below.
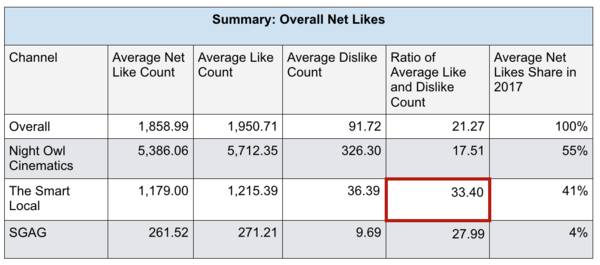
After zooming into each channel individually, we realised that The Smart Local is the only channel whose average net like counts is increasing with time whereas Night Owl Cinematics and SGAG are decreasing with time. This can be seen in the summary table below.
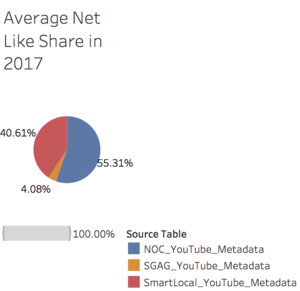
As seen in the pie chart below, in 2017, Night Owl Cinematics have the highest net likes share, however, their share has been dropping dramatically from 96% in 2014 to 55% in 2017 due to the increasing number of net likes from SGAG and The Smart Local. It is also important to note that SGAG has the least share from 2014 to 2017. More details would be explored below.
Ratio of Average Like and Dislike Count
After confirming that the average likes and dislikes of each channel are statistically different from each other, we can then proceed to calculate the ratio of average like and dislike count. This was done to obtain a fair comparison across channels, as seen in the table below, Night Owl Cinematics have the lowest ratio, implying that their videos are relatively more polarising than SGAG and The Smart Local. The Smart Local is the leader in terms of this ratio.
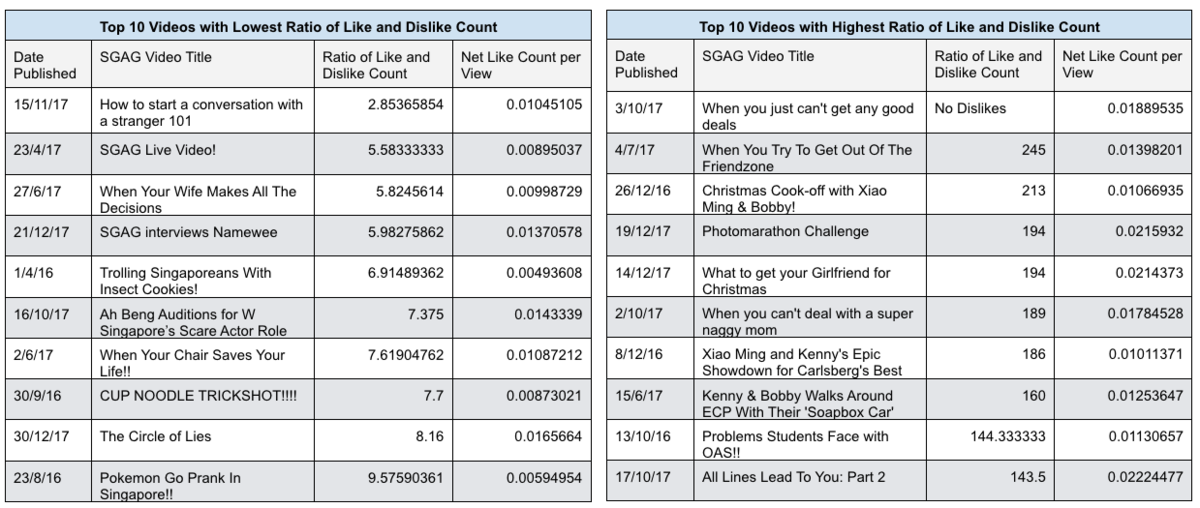
In addition, SGAG should take a look at their top and bottom 10 performing videos (in terms of this ratio), to understand what worked and what did not. The top and bottom 10 videos can be seen in the table below.
Average Net Likes per View Trends
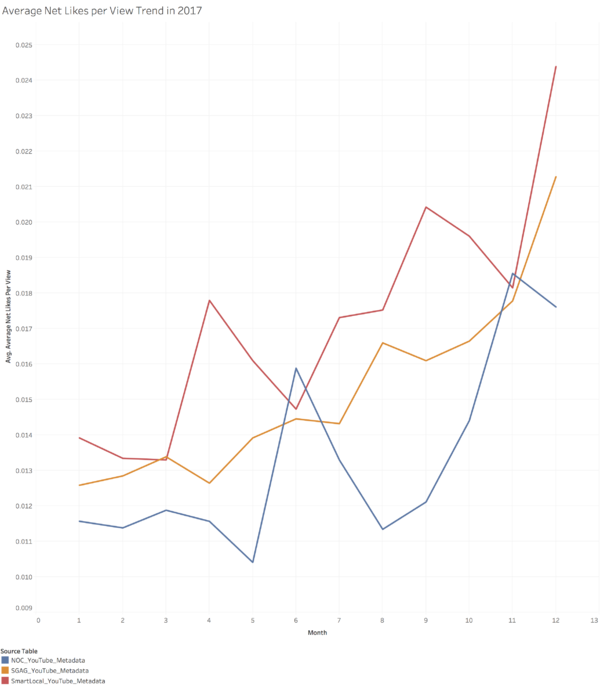
As seen in the graph below, all channels have been increasing in terms of average net likes per view in 2017. However, it is clear that Night Owl Cinematics has been lagging behind SGAG and The Smart Local. In addition, the average net likes per view is not statistically different for SGAG and The Smart Local in 2017, implying that viewers think that each channel is as positive as each other.
Summary
A summary of insights derived from analysis of net likes can be seen below:
- Night Owl Cinematics have the highest average net like count while SGAG has the lowest.
- In terms of total net like count share, Night Owl Cinematics has the majority share but its percentage share has been steadily declining since 2014. The Smart Local has been increasing rapid whereas SGAG has increased slightly and has been the lowest consistently.
- The average net like count of all channels collectively has been decreasing since 2015.
- Total number of net like count of all channels collectively have been increasing.
- The Smart Local is the leader in terms of the ratio of average like and dislike count whereas Night Owl Cinematic is the last.
- The Smart Local is the only channel whose average net like count is increasing with time, with an increasing average net like per view. SGAG has decreased the most.
- The Smart Local and SGAG are performing equally well in terms of average net likes per view in 2017.
Collectively, it implies that:
- Viewers are leaving less likes on average for each video.
- SGAG’s low average net like count stems from the low number of views and not because viewers do not like their videos as much.
- SGAG needs to investigate the top 10 and bottom 10 videos as highlighted above, learning from what worked and what did not.
- SGAG’s and The Smart Local’s videos are not as polarizing as Night Owl Cinematics’ videos.
- The Smart Local is the leader in terms of likes for videos.
- Users perceive SGAG and The Smart Local’s to be most positive in 2017.
- The Smart Local has performed consistently well in terms of average net like count and is the leader.
Tools Used
We used the following tools to perform the above analysis:
- Python
- Tableau
- JMP Pro
- Excel
In progress.


