Difference between revisions of "AY1617 T5 Team AP Findings"
| Line 21: | Line 21: | ||
<font face ="Impact" color= #566573 size="4" >Character</font><br> | <font face ="Impact" color= #566573 size="4" >Character</font><br> | ||
| − | [[Image:EDA_CHARACTER.PNG|500px|center]]<br> | + | [[Image:EDA_CHARACTER.PNG|500px|center]] |
| − | [[Image:EDA_CHARACTER_1.PNG|600px|center]]<br> | + | <div style="text-align: center;font-size:1.2em; font-weight:bold">Fig 1</div><br> |
| − | [[Image:EDA_CHARACTER_2.PNG|600px|center]]<br> | + | [[Image:EDA_CHARACTER_1.PNG|600px|center]] |
| + | <div style="text-align: center;font-size:1.2em; font-weight:bold">Fig 2</div><br> | ||
| + | [[Image:EDA_CHARACTER_2.PNG|600px|center]] | ||
| + | <div style="text-align: center;font-size:1.2em; font-weight:bold">Fig 3</div><br> | ||
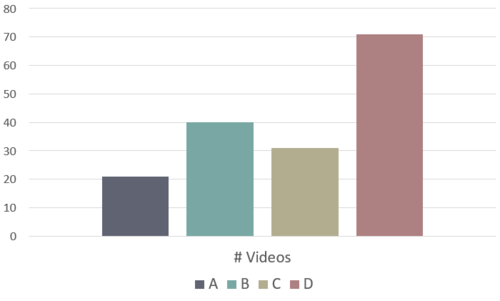
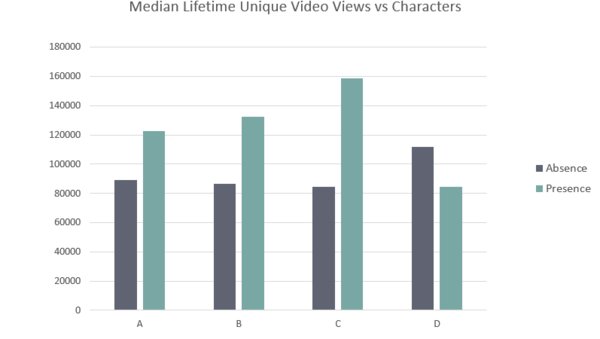
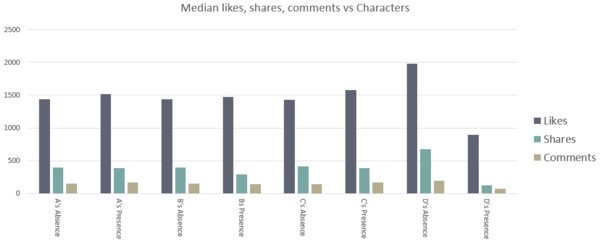
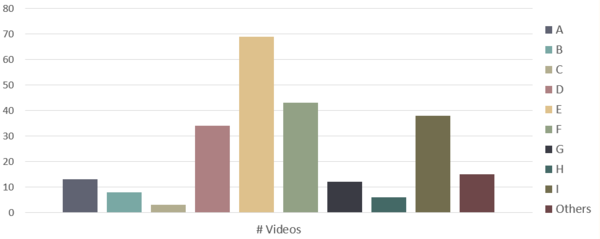
With reference to Fig 2 and Fig 3, other than Character D, the rest of the characters garnered higher median views when they appear in the videos compared to those which they do not appear in. However, looking at Fig 1, Character D actually has the most video appearance among the 4 characters. This makes it a strange phenomenon that we intend to investigate further into our analysis. If Character D appearance is statistically proven to decrease a video’s performance, SGAG should consider reducing the amount of appearances he makes. | With reference to Fig 2 and Fig 3, other than Character D, the rest of the characters garnered higher median views when they appear in the videos compared to those which they do not appear in. However, looking at Fig 1, Character D actually has the most video appearance among the 4 characters. This makes it a strange phenomenon that we intend to investigate further into our analysis. If Character D appearance is statistically proven to decrease a video’s performance, SGAG should consider reducing the amount of appearances he makes. | ||
<font face ="Impact" color= #566573 size="4" >Tier</font><br> | <font face ="Impact" color= #566573 size="4" >Tier</font><br> | ||
| − | [[Image:EDA_TIER.PNG|500px|center]]<br> | + | [[Image:EDA_TIER.PNG|500px|center]] |
| − | [[Image:EDA_TIER_1.PNG|600px|center]]<br> | + | <div style="text-align: center;font-size:1.2em; font-weight:bold">Fig 4</div><br> |
| + | [[Image:EDA_TIER_1.PNG|600px|center]] | ||
| + | <div style="text-align: center;font-size:1.2em; font-weight:bold">Fig 5</div><br> | ||
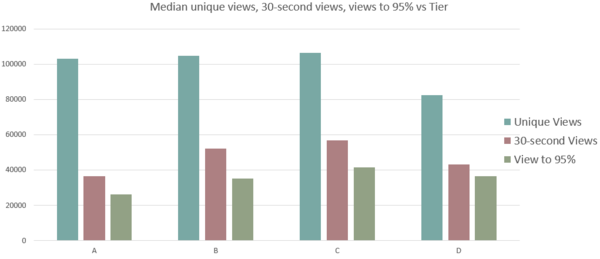
Referring to Fig 4, the tier with the highest viewership is tier C. Tier B, C and D shows similar view time attrition rate of around 50% derived from the ratio of lifetime unique views to lifetime unique 30 seconds view. Tier A shows the highest view time attrition rate. This could be due to the type of videos which are categorised in this category. | Referring to Fig 4, the tier with the highest viewership is tier C. Tier B, C and D shows similar view time attrition rate of around 50% derived from the ratio of lifetime unique views to lifetime unique 30 seconds view. Tier A shows the highest view time attrition rate. This could be due to the type of videos which are categorised in this category. | ||
<font face ="Impact" color= #566573 size="4" >Genre</font><br> | <font face ="Impact" color= #566573 size="4" >Genre</font><br> | ||
| − | [[Image:EDA_GENRE.PNG|600px|center]]<br> | + | [[Image:EDA_GENRE.PNG|600px|center]] |
| − | [[Image:EDA_GENRE_1.PNG|800px|center]]<br> | + | <div style="text-align: center;font-size:1.2em; font-weight:bold">Fig 6</div><br> |
| − | Videos from G have the best median performance among all the genres (Fig 6), but with relatively high attrition rates indicated by a high ratio of lifetime unique view to lifetime unique 95% view. An interesting observation can be seen in the B, where there is a small difference between lifetime unique views and lifetime unique view to 95%, which indicate that viewers are more likely to sit through B series as compared to the other genres(low attrition rate or high retention ratio). One possible reason could be due to B being generally much shorter in its time duration, which increases the probability of the audience watching to 95% completion or 30 seconds. (e.g. 95% of a 40 seconds video is 38 seconds.) A similar trend is also observed for I videos. <br> | + | [[Image:EDA_GENRE_1.PNG|800px|center]] |
| − | [[Image:EDA_GENRE_2.PNG|600px|center]]<br> | + | <div style="text-align: center;font-size:1.2em; font-weight:bold">Fig 7</div><br> |
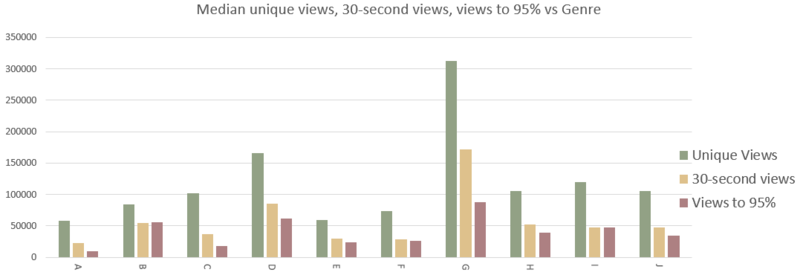
| − | [[Image:EDA_GENRE_3.PNG|800px|center]]<br> | + | Videos from G have the best median performance among all the genres (Fig 6), but with relatively high attrition rates indicated by a high ratio of lifetime unique view to lifetime unique 95% view. An interesting observation can be seen in the B, where there is a small difference between lifetime unique views and lifetime unique view to 95%, which indicate that viewers are more likely to sit through B series as compared to the other genres(low attrition rate or high retention ratio). One possible reason could be due to B being generally much shorter in its time duration, which increases the probability of the audience watching to 95% completion or 30 seconds. (e.g. 95% of a 40 seconds video is 38 seconds.) A similar trend is also observed for I genre videos. <br> |
| + | [[Image:EDA_GENRE_2.PNG|600px|center]] | ||
| + | <div style="text-align: center;font-size:1.2em; font-weight:bold">Fig 8</div><br> | ||
| + | [[Image:EDA_GENRE_3.PNG|800px|center]] | ||
| + | <div style="text-align: center;font-size:1.2em; font-weight:bold">Fig 9</div><br> | ||
On the other hand, when we are looking at the median click-to-play, auto-play and unique video views, A emerged at the top for all 3 categories among internal videos. (Fig 7) Another interesting insight was that A has the highest number of click-to-play video views. This could potentially indicate that the A is a category that SGAG audience would want to click and view its contents to find out more rather than the video being autoplayed. Thus, A might also be the one genre which strongly captures the interests of their audience.<br> | On the other hand, when we are looking at the median click-to-play, auto-play and unique video views, A emerged at the top for all 3 categories among internal videos. (Fig 7) Another interesting insight was that A has the highest number of click-to-play video views. This could potentially indicate that the A is a category that SGAG audience would want to click and view its contents to find out more rather than the video being autoplayed. Thus, A might also be the one genre which strongly captures the interests of their audience.<br> | ||
<font face ="Impact" color= #566573 size="4" >Quality</font><br> | <font face ="Impact" color= #566573 size="4" >Quality</font><br> | ||
| − | [[Image:EDA_QUALITY.PNG|500px|center]]<br> | + | [[Image:EDA_QUALITY.PNG|500px|center]] |
| − | [[Image:EDA_QUALITY_1.PNG|500px|center]]<br> | + | <div style="text-align: center;font-size:1.2em; font-weight:bold">Fig 10</div><br> |
| + | [[Image:EDA_QUALITY_1.PNG|500px|center]] | ||
| + | <div style="text-align: center;font-size:1.2em; font-weight:bold">Fig 11</div><br> | ||
From Fig 11, we observe that quality A videos produce better performance as compared to quality B videos in all three types of Facebook interactions. With SGAG producing more quality A videos (Fig 10), indicating that they are on the right track in this aspect. <br> | From Fig 11, we observe that quality A videos produce better performance as compared to quality B videos in all three types of Facebook interactions. With SGAG producing more quality A videos (Fig 10), indicating that they are on the right track in this aspect. <br> | ||
| − | [[Image:EDA_QUALITY_2.PNG|500px|center]]< | + | [[Image:EDA_QUALITY_2.PNG|500px|center]] |
| + | <div style="text-align: center;font-size:1.2em; font-weight:bold">Fig 12</div><br> | ||
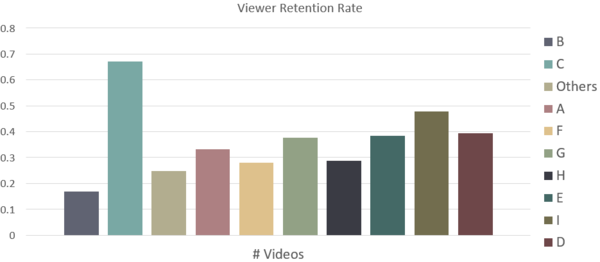
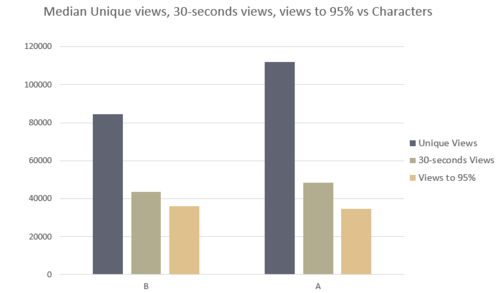
According to Fig 12, the quality B videos are now doing better quality A videos in terms of absolute unique video views. However, quality A videos’ graphs has higher median unique 30 seconds view and median view to 95% than quality B videos. Furthermore, quality B videos seem to have better retention ratio than quality A videos. As both types of video qualities seem to out-perform each other in different aspects, we would require further analysis to investigate how quality ultimately affects overall video performance. <br> | According to Fig 12, the quality B videos are now doing better quality A videos in terms of absolute unique video views. However, quality A videos’ graphs has higher median unique 30 seconds view and median view to 95% than quality B videos. Furthermore, quality B videos seem to have better retention ratio than quality A videos. As both types of video qualities seem to out-perform each other in different aspects, we would require further analysis to investigate how quality ultimately affects overall video performance. <br> | ||
<font face ="Impact" color= #566573 size="4">Sponsored?</font><br> | <font face ="Impact" color= #566573 size="4">Sponsored?</font><br> | ||
| − | [[Image:EDA_SPONSORED.PNG|500px|center]]<br> | + | [[Image:EDA_SPONSORED.PNG|500px|center]] |
| − | [[Image:EDA_SPONSORED_1.PNG|500px|center]]<br> | + | <div style="text-align: center;font-size:1.2em; font-weight:bold">Fig 13</div><br> |
| + | [[Image:EDA_SPONSORED_1.PNG|500px|center]] | ||
| + | <div style="text-align: center;font-size:1.2em; font-weight:bold">Fig 14</div><br> | ||
A show better performance in unique video views while both A and B fair similarly for view to 30 seconds and views to 95%. (Fig 13) A higher view time attrition rate is observed for A as seen from a higher Lifetime unique video views to Lifetime unique view to 95% ratio. This could be related to business choosing videos from a particular tier which contributes to more of A. | A show better performance in unique video views while both A and B fair similarly for view to 30 seconds and views to 95%. (Fig 13) A higher view time attrition rate is observed for A as seen from a higher Lifetime unique video views to Lifetime unique view to 95% ratio. This could be related to business choosing videos from a particular tier which contributes to more of A. | ||
| Line 61: | Line 75: | ||
==<font face ="Impact" color= #00ADEF size="5">MULTIVARIATE ANALYSIS</font>== | ==<font face ="Impact" color= #00ADEF size="5">MULTIVARIATE ANALYSIS</font>== | ||
[[Image:EDA_MULTIV.PNG|350px|center]] | [[Image:EDA_MULTIV.PNG|350px|center]] | ||
| + | <div style="text-align: center;font-size:1.2em; font-weight:bold">Fig 15</div><br> | ||
Referring to the results of a multivariate analysis above, all of the variables are highly correlated to one another. Therefore, we have decided to adopt the Principal Component Analysis (PCA) method, which uses an octagonal transformation to convert our 4 correlated variables into a set of values of linearly uncorrelated variables, which are our principal components. PCA allows us to extract patterns that were previously not obvious before the analysis. | Referring to the results of a multivariate analysis above, all of the variables are highly correlated to one another. Therefore, we have decided to adopt the Principal Component Analysis (PCA) method, which uses an octagonal transformation to convert our 4 correlated variables into a set of values of linearly uncorrelated variables, which are our principal components. PCA allows us to extract patterns that were previously not obvious before the analysis. | ||
[[Image:EDA_EIGEN.PNG|350px|center]] | [[Image:EDA_EIGEN.PNG|350px|center]] | ||
| + | <div style="text-align: center;font-size:1.2em; font-weight:bold">Fig 16</div><br> | ||
Looking at the Eigenvalues of our PCA, since the PRIN-1 is able to yield close to 93%, we would be using that for the rest of our analysis. Eigenvalues show how much each principal component accounts for in terms of the percentage of the aggregate performance variation. | Looking at the Eigenvalues of our PCA, since the PRIN-1 is able to yield close to 93%, we would be using that for the rest of our analysis. Eigenvalues show how much each principal component accounts for in terms of the percentage of the aggregate performance variation. | ||
| Line 71: | Line 87: | ||
<br> | <br> | ||
<font face ="Impact" color= #566573 size="4">Character</font><br> | <font face ="Impact" color= #566573 size="4">Character</font><br> | ||
| − | [[Image:PCA_CHARACTER.PNG|500px|center]]<br> | + | [[Image:PCA_CHARACTER.PNG|500px|center]] |
| + | <div style="text-align: center;font-size:1.2em; font-weight:bold">Fig 17</div><br> | ||
The first finding which we observed was that the videos’ performance without Character D seem to be performing better than those with him. (p-value<0.05) In the ordered differences report below, the value 0 represents absence of Character D and 1 represents his presence in a video. (Fig 17) However, this could also be due to the other character appearing in lesser videos and thus having lesser data points for comparison. This phenomenon was consistent throughout all of the 4 quarters as well during our quarter by quarter analysis.<br> | The first finding which we observed was that the videos’ performance without Character D seem to be performing better than those with him. (p-value<0.05) In the ordered differences report below, the value 0 represents absence of Character D and 1 represents his presence in a video. (Fig 17) However, this could also be due to the other character appearing in lesser videos and thus having lesser data points for comparison. This phenomenon was consistent throughout all of the 4 quarters as well during our quarter by quarter analysis.<br> | ||
<font face ="Impact" color= #566573 size="4" >Tier</font><br> | <font face ="Impact" color= #566573 size="4" >Tier</font><br> | ||
| − | [[Image:PCA_TIER.PNG|500px|center]]<br> | + | [[Image:PCA_TIER.PNG|500px|center]] |
| + | <div style="text-align: center;font-size:1.2em; font-weight:bold">Fig 18</div><br> | ||
Another observation which we have observed in the year based analysis was tier D videos tend to have better performance compared to tier A videos. As shown in Fig 18, we can see the Level D and - Level A shows significance with p-Value of 0.0066. <br> | Another observation which we have observed in the year based analysis was tier D videos tend to have better performance compared to tier A videos. As shown in Fig 18, we can see the Level D and - Level A shows significance with p-Value of 0.0066. <br> | ||
<font face ="Impact" color= #566573 size="4" >Genre</font><br> | <font face ="Impact" color= #566573 size="4" >Genre</font><br> | ||
| − | [[Image:PCA_GENRE.PNG|600px|center]]<br> | + | [[Image:PCA_GENRE.PNG|600px|center]] |
| + | <div style="text-align: center;font-size:1.2em; font-weight:bold">Fig 19</div><br> | ||
For Genre, Genre H is performing better than B,D and E. <br> | For Genre, Genre H is performing better than B,D and E. <br> | ||
<font face ="Impact" color= #566573 size="4" >Quality and Sponsored</font><br> | <font face ="Impact" color= #566573 size="4" >Quality and Sponsored</font><br> | ||
| − | [[Image:PCA_QUALITY.PNG|500px|center]]<br> | + | [[Image:PCA_QUALITY.PNG|500px|center]] |
| − | [[Image:PCA_SPONSORED.PNG|500px|center]]<br> | + | <div style="text-align: center;font-size:1.2em; font-weight:bold">Fig 20</div><br> |
| + | [[Image:PCA_SPONSORED.PNG|500px|center]] | ||
| + | <div style="text-align: center;font-size:1.2em; font-weight:bold">Fig 21</div><br> | ||
Since the p-values for both Quality and Sponsored variables are more than 0.05, it means that whether the quality is low or high, whether a video is sponsored or not sponsored, is statistically insignificant, meaning, it does not make a difference to the videos' performances. | Since the p-values for both Quality and Sponsored variables are more than 0.05, it means that whether the quality is low or high, whether a video is sponsored or not sponsored, is statistically insignificant, meaning, it does not make a difference to the videos' performances. | ||
<br> | <br> | ||
<nowiki>**</nowiki> All values of the variables have been censored away due to the sensitivity of our data and its findings. We hope to seek your understanding. | <nowiki>**</nowiki> All values of the variables have been censored away due to the sensitivity of our data and its findings. We hope to seek your understanding. | ||
Revision as of 23:26, 21 February 2017
Contents
EXPLORATORY DATA ANALYSIS
Character
With reference to Fig 2 and Fig 3, other than Character D, the rest of the characters garnered higher median views when they appear in the videos compared to those which they do not appear in. However, looking at Fig 1, Character D actually has the most video appearance among the 4 characters. This makes it a strange phenomenon that we intend to investigate further into our analysis. If Character D appearance is statistically proven to decrease a video’s performance, SGAG should consider reducing the amount of appearances he makes.
Tier
Referring to Fig 4, the tier with the highest viewership is tier C. Tier B, C and D shows similar view time attrition rate of around 50% derived from the ratio of lifetime unique views to lifetime unique 30 seconds view. Tier A shows the highest view time attrition rate. This could be due to the type of videos which are categorised in this category.
Genre
Videos from G have the best median performance among all the genres (Fig 6), but with relatively high attrition rates indicated by a high ratio of lifetime unique view to lifetime unique 95% view. An interesting observation can be seen in the B, where there is a small difference between lifetime unique views and lifetime unique view to 95%, which indicate that viewers are more likely to sit through B series as compared to the other genres(low attrition rate or high retention ratio). One possible reason could be due to B being generally much shorter in its time duration, which increases the probability of the audience watching to 95% completion or 30 seconds. (e.g. 95% of a 40 seconds video is 38 seconds.) A similar trend is also observed for I genre videos.
On the other hand, when we are looking at the median click-to-play, auto-play and unique video views, A emerged at the top for all 3 categories among internal videos. (Fig 7) Another interesting insight was that A has the highest number of click-to-play video views. This could potentially indicate that the A is a category that SGAG audience would want to click and view its contents to find out more rather than the video being autoplayed. Thus, A might also be the one genre which strongly captures the interests of their audience.
Quality
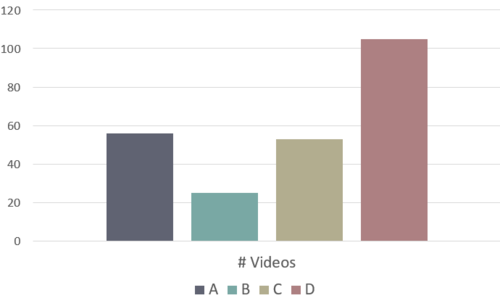
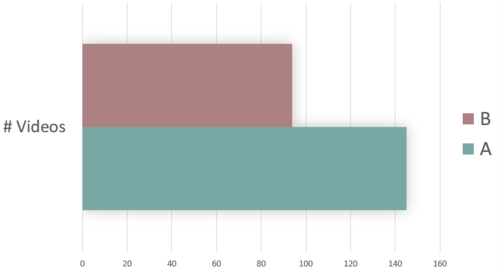
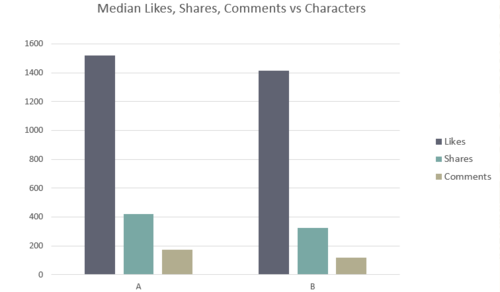
From Fig 11, we observe that quality A videos produce better performance as compared to quality B videos in all three types of Facebook interactions. With SGAG producing more quality A videos (Fig 10), indicating that they are on the right track in this aspect.
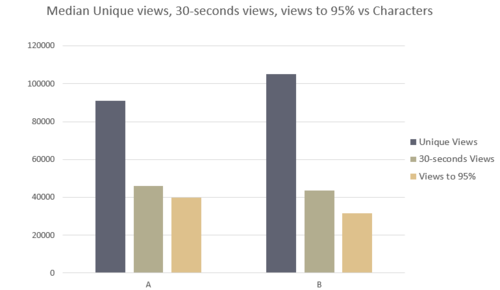
According to Fig 12, the quality B videos are now doing better quality A videos in terms of absolute unique video views. However, quality A videos’ graphs has higher median unique 30 seconds view and median view to 95% than quality B videos. Furthermore, quality B videos seem to have better retention ratio than quality A videos. As both types of video qualities seem to out-perform each other in different aspects, we would require further analysis to investigate how quality ultimately affects overall video performance.
Sponsored?
A show better performance in unique video views while both A and B fair similarly for view to 30 seconds and views to 95%. (Fig 13) A higher view time attrition rate is observed for A as seen from a higher Lifetime unique video views to Lifetime unique view to 95% ratio. This could be related to business choosing videos from a particular tier which contributes to more of A.
KPI
Our client has identified 4 key performance indicators (KPI) for the videos - the number of unique views, number of likes, number of shares and number of comments. Due to the huge difference in the range that these KPIs fall under, data transformation has to be done to normalize them. We have adopted the Johnson Su transformation for all 4 of the variables to follow a normal distribution.
MULTIVARIATE ANALYSIS
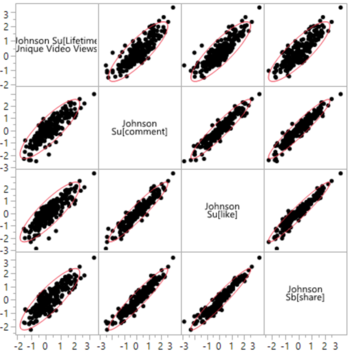
Referring to the results of a multivariate analysis above, all of the variables are highly correlated to one another. Therefore, we have decided to adopt the Principal Component Analysis (PCA) method, which uses an octagonal transformation to convert our 4 correlated variables into a set of values of linearly uncorrelated variables, which are our principal components. PCA allows us to extract patterns that were previously not obvious before the analysis.
Looking at the Eigenvalues of our PCA, since the PRIN-1 is able to yield close to 93%, we would be using that for the rest of our analysis. Eigenvalues show how much each principal component accounts for in terms of the percentage of the aggregate performance variation.
PRINCIPAL COMPONENT ANALYSIS (PCA)
Further Analysis
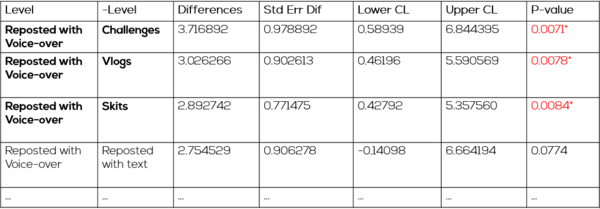
From the PCA results of all our existing factors (Character, Genre etc.) , we were able to find out which values under the different factors (Character A, B, C etc.) were contributing to the videos' performance, and whether it was a positive or negative impact. Due to our small data set, there were instances where the values of a factor were unable to be distinguish as statistically different. Thus, in order to tackle that problem, we are planning to either carry out nonparametric analysis to distinguish them, or simulate more data points using the profiler function using our current set of data.
Character
The first finding which we observed was that the videos’ performance without Character D seem to be performing better than those with him. (p-value<0.05) In the ordered differences report below, the value 0 represents absence of Character D and 1 represents his presence in a video. (Fig 17) However, this could also be due to the other character appearing in lesser videos and thus having lesser data points for comparison. This phenomenon was consistent throughout all of the 4 quarters as well during our quarter by quarter analysis.
Tier
Another observation which we have observed in the year based analysis was tier D videos tend to have better performance compared to tier A videos. As shown in Fig 18, we can see the Level D and - Level A shows significance with p-Value of 0.0066.
Genre
For Genre, Genre H is performing better than B,D and E.
Quality and Sponsored
Since the p-values for both Quality and Sponsored variables are more than 0.05, it means that whether the quality is low or high, whether a video is sponsored or not sponsored, is statistically insignificant, meaning, it does not make a difference to the videos' performances.
** All values of the variables have been censored away due to the sensitivity of our data and its findings. We hope to seek your understanding.


