Difference between revisions of "AY1617 T5 Team AP Findings"
| Line 20: | Line 20: | ||
==<font face ="Impact" color= #00ADEF size="5" >EXPLORATORY DATA ANALYSIS</font>== | ==<font face ="Impact" color= #00ADEF size="5" >EXPLORATORY DATA ANALYSIS</font>== | ||
| − | <font face ="Impact" color= #566573 size=" | + | <font face ="Impact" color= #566573 size="4" >Character</font><br> |
[[Image:EDA_CHARACTER.PNG|400px|center]]<br> | [[Image:EDA_CHARACTER.PNG|400px|center]]<br> | ||
[[Image:EDA_CHARACTER_1.PNG|450px]] | [[Image:EDA_CHARACTER_1.PNG|450px]] | ||
[[Image:EDA_CHARACTER_2.PNG|550px]] | [[Image:EDA_CHARACTER_2.PNG|550px]] | ||
| − | <font face ="Impact" color= #566573 size=" | + | <font face ="Impact" color= #566573 size="4" >Tier</font><br> |
[[Image:EDA_TIER.PNG|380px|]] | [[Image:EDA_TIER.PNG|380px|]] | ||
[[Image:EDA_TIER_1.PNG|620px|]]<br> | [[Image:EDA_TIER_1.PNG|620px|]]<br> | ||
| − | <font face ="Impact" color= #566573 size=" | + | <font face ="Impact" color= #566573 size="4" >Genre</font><br> |
[[Image:EDA_GENRE.PNG|600px|center]]<br> | [[Image:EDA_GENRE.PNG|600px|center]]<br> | ||
[[Image:EDA_GENRE_1.PNG|800px|center]]<br> | [[Image:EDA_GENRE_1.PNG|800px|center]]<br> | ||
| Line 35: | Line 35: | ||
[[Image:EDA_GENRE_3.PNG|800px|center]]<br> | [[Image:EDA_GENRE_3.PNG|800px|center]]<br> | ||
| − | <font face ="Impact" color= #566573 size=" | + | <font face ="Impact" color= #566573 size="4" >Quality</font><br> |
[[Image:EDA_QUALITY.PNG|400px|center]]<br> | [[Image:EDA_QUALITY.PNG|400px|center]]<br> | ||
[[Image:EDA_QUALITY_1.PNG|500px]] | [[Image:EDA_QUALITY_1.PNG|500px]] | ||
[[Image:EDA_QUALITY_2.PNG|500px]]<br><br> | [[Image:EDA_QUALITY_2.PNG|500px]]<br><br> | ||
| − | <font face ="Impact" color= #566573 size=" | + | <font face ="Impact" color= #566573 size="4">Sponsored?</font><br> |
[[Image:EDA_SPONSORED.PNG|500px]] | [[Image:EDA_SPONSORED.PNG|500px]] | ||
[[Image:EDA_SPONSORED_1.PNG|500px]]<br> | [[Image:EDA_SPONSORED_1.PNG|500px]]<br> | ||
| Line 57: | Line 57: | ||
<font face ="Impact" color= #00ADEF size="5">Further Analysis</font><br> | <font face ="Impact" color= #00ADEF size="5">Further Analysis</font><br> | ||
From the PCA results of all our existing factors (Character, Genre etc.) , we were able to find out which values under the different factors (Character A, B, C etc.) were contributing to the videos' performance, and whether it was a positive or negative impact. Due to our small data set, there were instances where the values of a factor were unable to be distinguish as statistically different. Thus, in order to tackle that problem, we are planning to either carry out nonparametric analysis to distinguish them, or simulate more data points using the profiler function using our current set of data. | From the PCA results of all our existing factors (Character, Genre etc.) , we were able to find out which values under the different factors (Character A, B, C etc.) were contributing to the videos' performance, and whether it was a positive or negative impact. Due to our small data set, there were instances where the values of a factor were unable to be distinguish as statistically different. Thus, in order to tackle that problem, we are planning to either carry out nonparametric analysis to distinguish them, or simulate more data points using the profiler function using our current set of data. | ||
| + | |||
| + | <font face ="Impact" color= #566573 size="4">Character</font><br> | ||
| + | [[Image:PCA_CHARACTER.PNG|500px|center]]<br> | ||
| + | <font face ="Impact" color= #566573 size="4" >Tier</font><br> | ||
| + | [[Image:PCA_TIER.PNG|500px|center]]<br> | ||
| + | <font face ="Impact" color= #566573 size="4" >Genre</font><br> | ||
| + | [[Image:PCA_GENRE.PNG|500px|center]]<br> | ||
| + | <font face ="Impact" color= #566573 size="4" >Quality</font><br> | ||
| + | [[Image:PCA_QUALITY.PNG|500px|center]]<br> | ||
| + | <font face ="Impact" color= #566573 size="4" >Sponsored?</font><br> | ||
| + | [[Image:PCA_SPONSORED.PNG|500px|center]]<br> | ||
Revision as of 21:42, 21 February 2017
Contents
EXPLORATORY DATA ANALYSIS
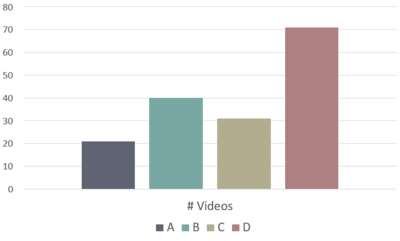
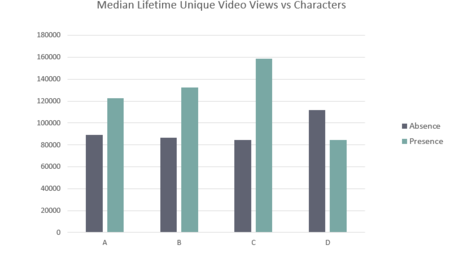
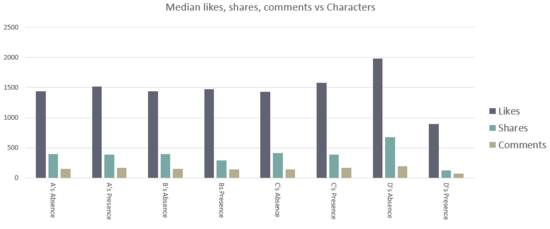
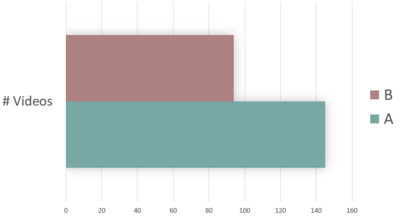
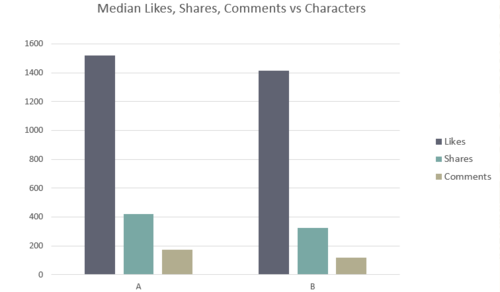
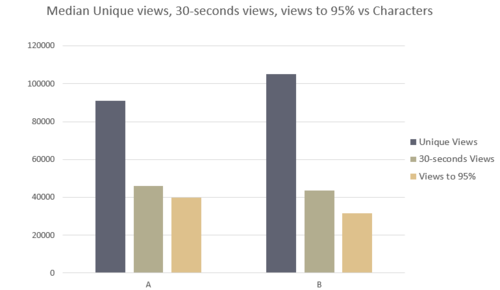
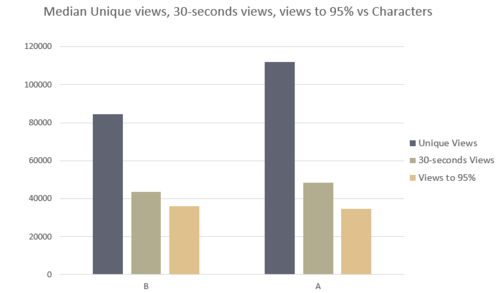
Character
Genre
Quality
KPI
Our client has identified 4 key performance indicators (KPI) for the videos - the number of unique views, number of likes, number of shares and number of comments. Due to the huge difference in the range that these KPIs fall under, data transformation has to be done to normalize them. We have adopted the Johnson Su transformation for all 4 of the variables to follow a normal distribution.
MULTIVARIATE ANALYSIS
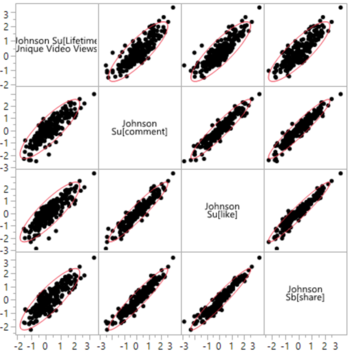
Referring to the results of a multivariate analysis above, all of the variables are highly correlated to one another. Therefore, we have decided to adopt the Principal Component Analysis (PCA) method, which uses an octagonal transformation to convert our 4 correlated variables into a set of values of linearly uncorrelated variables, which are our principal components. PCA allows us to extract patterns that were previously not obvious before the analysis.
Looking at the Eigenvalues of our PCA, since the PRIN-1 is able to yield close to 93%, we would be using that for the rest of our analysis. Eigenvalues show how much each principal component accounts for in terms of the percentage of the aggregate performance variation.
PRINCIPAL COMPONENT ANALYSIS (PCA)
Further Analysis
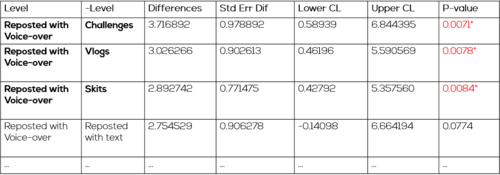
From the PCA results of all our existing factors (Character, Genre etc.) , we were able to find out which values under the different factors (Character A, B, C etc.) were contributing to the videos' performance, and whether it was a positive or negative impact. Due to our small data set, there were instances where the values of a factor were unable to be distinguish as statistically different. Thus, in order to tackle that problem, we are planning to either carry out nonparametric analysis to distinguish them, or simulate more data points using the profiler function using our current set of data.
Character
Tier
Genre
Quality
Sponsored?


