Difference between revisions of "ANLY482 AY2016-17 T2 Group11: Project Management"
Jump to navigation
Jump to search
| Line 12: | Line 12: | ||
<br> | <br> | ||
| − | <div style="background: linear-gradient(#F9660E, #EE3D10); padding: 15px; font-weight: bold; line-height: 0.3em; text-indent: 0px; font-size:20px; font-family:helvetica"><font color= #FFFFFF> | + | <div style="background: linear-gradient(#F9660E, #EE3D10); padding: 15px; font-weight: bold; line-height: 0.3em; text-indent: 0px; font-size:20px; font-family:helvetica"><font color= #FFFFFF>Project Timeline</font></div> |
| − | [[Image: T11_Gantt_Chart.png]] | + | To ensure that the project is on track and that the team is accountable to the project sponsor, the following Gantt Chart illustrates the workflow for the next 16 weeks leading up to the last milestone, the final presentation. |
| + | |||
| + | [[Image: T11_Gantt_Chart.png|center|800x500px]] | ||
Revision as of 23:52, 8 January 2017
| HOME | ABOUT US | PROJECT OVERVIEW | PROJECT MANAGEMENT | PROJECT FINDINGS | DOCUMENTATION |
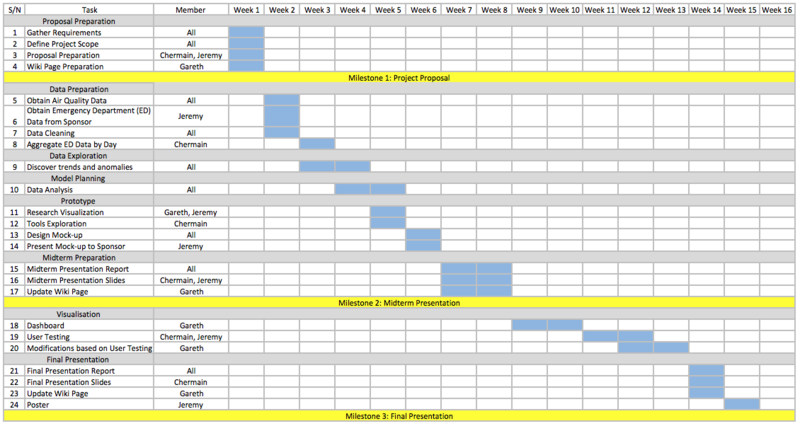
Project Timeline
To ensure that the project is on track and that the team is accountable to the project sponsor, the following Gantt Chart illustrates the workflow for the next 16 weeks leading up to the last milestone, the final presentation.
