ANLY482 AY2017-18 T2 Group 17 Findings Finals
| Exploratory Data Analysis | Confirmatory Data Analysis |
|---|
Wilcoxon test
In attempt to analyse user behaviour pattern, the time spent on each chapter is calculated using the proxy data. On the condition that ‘SessionID’ is similar for each row, the proxy for time spend on each chapter (t) is calculated using the following equation;
datetime(t-1) - datetime(t)
As time spent per chapter is a calculated field, prior information of the distribution is unknown. As such, a parametric test of means comparison between different strata will not be appropriate as certain assumption will have to be made on the distribution for instance if data follows a normal distribution. Therefore, a non-parametric test is performed on the data instead.
Since the data is highly skewed towards the left-hand side, a Wilcoxon test is used to analyse if there is a significant difference in time spent between each strata of interest. In Wilcoxon test, comparison is done using the medium of each group. Using medium as a benchmark will help minimize the biasness resulting from the skewed population. In the analysis the groups of interests are as follows;
1. Analysis by distinct user utilization of books
2. Analysis by chapter view and chapter downloads
3. Analysis by different user groups
Analysis by distinct user utilization of books
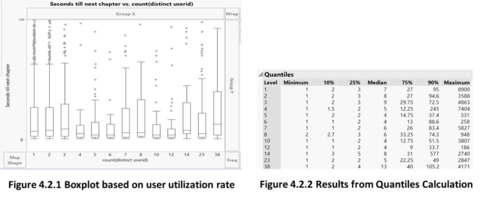
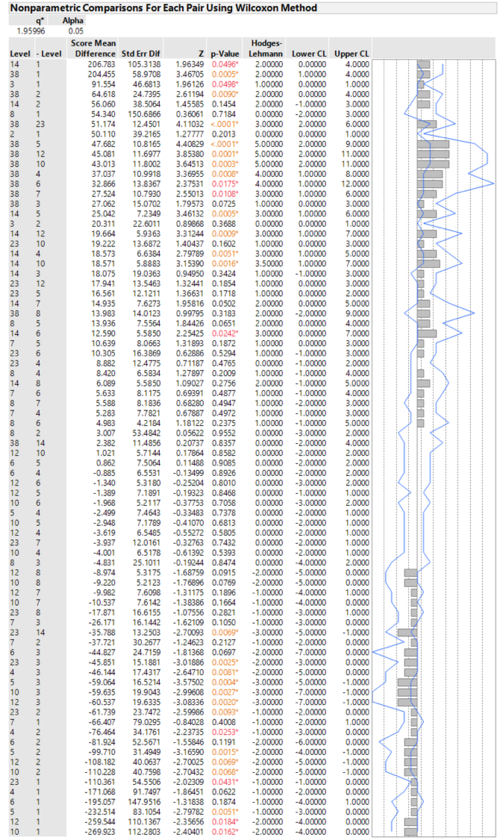
The boxplot diagram shows the distribution of time spent across the different distinct user utilization group. From the boxplot and table above, it is observed that there are differences between the median time spent on each chapter across different groups. For books that are used by more distinct users (38), the median time spend seems to be much higher than that by 1 distinct user. To compare the statistical difference, we perform a Wilcoxon test on each pair and noted the following results.
In general, there is are conflicting evidences on whether more popular books (ie accessed by more users) have a different browsing patterns by users. From the results, there is evidence which suggest that users behaviour patterns do differ between e-books with larger user groups and e-books with a smaller user groups. For instance, results show that between group 38 and group 1 where p-value is at 0.0005 and Score Mean difference at 204.445, there is a statistical difference between both groups with time spent per chapter in group 38 being significantly more.
However, there is also evidence that to show the e-books with larger user groups do not necessary spent more time per chapter in browsing the books compared to and e-books with a smaller user groups. For example, group 10 and group 1 where -value is at 0.0162and Score Mean difference at negative (269.923) which indicates that while there is significant difference between the 2 groups, group 1 users tend to spend more time per chapter than group 10.
Analysis by user group
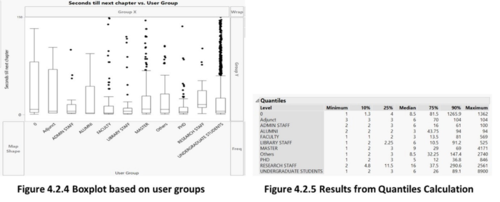
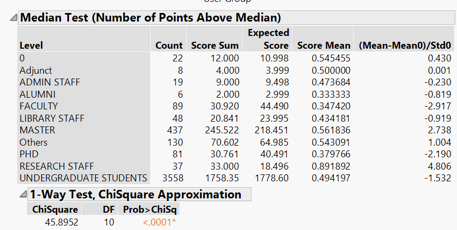
Similarly, for boxplot by user groups, differences are observed between every groups. A Wilcoxon test also shows that there is a significant difference between the median time spent on each chapter across different user groups.
Analysis between chapter view and PDF downloads
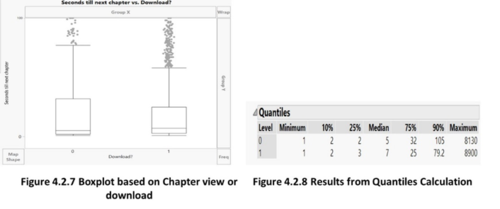
For boxplot by chapter view and PDF download, an interesting phenomenon as observed whereby despite the median of chapter view being lower than PDF downloads, the 75 percentile of chapter view is substantial higher than PDF download. An explanation could be that users who browse e-books through online view are more serious readers whereas for PDF downloads e-books are often skimmed through instead.
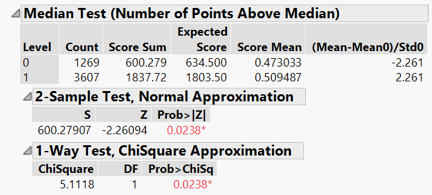
From the Wilcoxon test, there is statistical evidence to show that the median time spend on each chapter is different for group that view chapter online and group that download chapters.
