ANLY482 AY2017-18 Group9: Project Findings/ Clustering
Multicollinearity
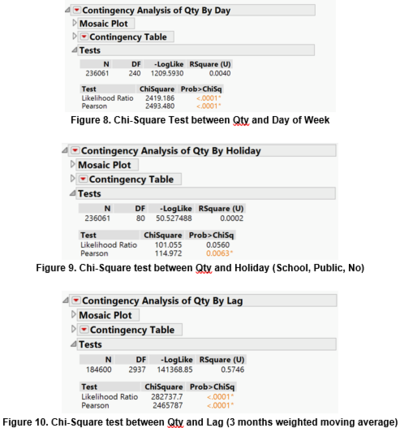
Multilinear regression is sensitive to extreme high correlation among independent variables, which will result in high standard error parameter estimates. A p-value ≤ 0.05 illustrate that independent variable is statistically different from the dependent variable. Herewith, we are conducting contingency analysis (chi-square test) to evaluate if the independent variables are statistically reliant on our dependent variable (Qty). As shown in Figure 8, 9 and 10, it illustrates the chi-square test between the 3 independent variables and the dependent variable (Qty). We can see that p-value are all below significant level of 0.05, henceforth, we can conclude that the independent variables all have a statistically different relationship from the dependent variable.
Quasi-complete separation in Multilinear Regression
Occasionally when running a multilinear regression model, it is possible to run into quasi-complete separation problem. Quasi-complete separation in multilinear regression simply meant perfect prediction, it happens when the outcome variable separates the predictor completely. For instance, if all the data in Y=0 has values X1<=3, and Y=1 has values X1 > 3, Y separates X1 perfectly. In this scenario, there is no perceived need to estimate a model as the maximum likelihood does not actually exist. Thus, we must ensure that no outcome variables are as a result of complete separation.
Evaluation of Model
Analysis for Tampines MRT Outlet for 7MM/2KG Tapioca Pearls
The reason for analysis of variance (ANOVA) is to test if the mean is sufficient to predict or explain the change of reordering quantity through the use JMP. ANOVA will be testing the following hypothesis:
H0: Mean is sufficient to explain the change of reordering qty
H1: Mean is insufficient to explain the change of reordering qty
From figure 11 above, we can see that p-value < 0.0001 and observe that p-value is lesser than significance value (α) of 0.05, thus, we can conclude that there is sufficient statistical evidence to reject null hypothesis. From the ANOVA Annova analysis, we can determine that there is insufficient evidence to explain the change of reordering quantity through the use of means only. Henceforth, it is prudent to conduct analysis on other independent variables.
The lack of fit test will be used to evaluate if our model fits the data well and if it is adequate in explaining the significance between the three variables computed (3-order moving average [lag], day of week, holiday [school, public, no]). The lack of fit test will be testing the following hypothesis:
H0: Multilinear model is adequate (there is no lack of fit)
H1: Multilinear model is not adequate (there is a lack of fit)
From figure 12 above, the p-value stood at 0.2816 which is more than significance value of 0.05, we do not reject null hypothesis and conclude that there is sufficient evidence at the α level to conclude that there is a no lack of fit in the regression model. This supports the conclusion that there is little value to be gained by adding new variables into the model, and thus we conclude that our current model is sufficient to explain the rate of change.
Parameter estimates (also known as coefficients) reflects the change in the response associated with one-unit change of the predictor (dependent variable = qty), with all other predictors held constant. Parameter estimates summarizes the effect of each predictor.
From figure 13 above, utilizing the t-test analysis, we can see that not all predictors are significant. For outlet Tampines MRT and Ingredient 7mm/2kg tapioca pearls, the only significant predictor will be lag (3-orders weighted moving average) with p-value < 0.0001. Thus, we can conclude that only lag predictor variable in the consideration of outlet= Tampines MRT and ingredient=7mm/2kg tapioca pearls will be useful as our independent variable for prediction in our model which will be covered in the later part of this report.
Analysis for Serangoon NEX Outlet for 7MM/2KG Tapioca Pearls
Likewise, from figure 14 ANOVA analysis, we can see that p-value < 0.0001 and observe that p-value is lesser than significance value (α) of 0.05, thus, we can conclude that there is sufficient statistical evidence to reject null hypothesis. Therefore, we can conclude that there is insufficient evidence to explain the change of reordering quantity through the use of means only.
Following which, figure 15 shows the lack of fit p-value stood at 0.9514 which is more than significance value of 0.05, therefore we do not reject null hypothesis and conclude that there is sufficient evidence at the α level to conclude that there is a no lack of fit in the regression model. This once again, supports the conclusion that there is little value to be gained by adding new variables into the model.
However, the difference lies within the parameter estimates. From figure 16, at significance value of 0.05, the significant predictors will be lag, day=Friday. Thus, we can conclude that “day of week” and “lag” predictor variable in the consideration of outlet=Serangoon NEX and ingredient=7mm/2kg tapioca pearls will be useful as our independent variable for prediction in our model.
From the above analysis, we can conclude that lag is not a significant variable to solely depend on our prediction, henceforth further analysis is required.
Table 4 summarize the outlets with their significant predictors for ingredient=7mm/2kg tapioca pearls. Keep in mind that this table only applies to one ingredient.


