ANLY482 AY2017-18T2 Group10 Project Overview: Methodology
Methodology
Based on information provided by ABC Company, 2 of it’s 8 outlets are considered “hybrid” outlets. This means that these outlets are located next to a Hotpot outlet, and thus have a shared kitchen and resources. The implication of this is that inventory records are not clearly delineated between the two concepts. Hence, as advised by ABC Company, these two outlets will be left out of the analyses performed, with reliance on the remaining six standalone outlets.
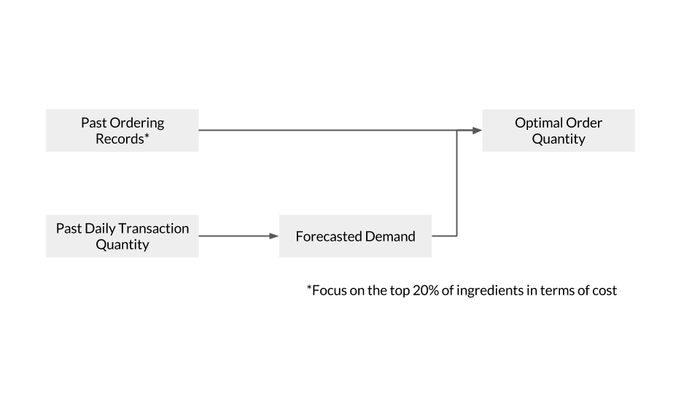
Next, as there has been a change in format of inventory data from October 2017, we will need to standardise the data for the preceding months. Afterwards, we will import the data into python to perform the necessary data cleaning and exploratory data analysis. After which, we will then begin to work on our model. Below is simple conceptual model of how the data will be used to produce the final optimal order quantity for an ingredient.
Upon completion of the EDA, the above mentioned methodology is currently under review as the team reevaluates the appropriate steps to obtain the desired objective
With this in mind, we have brainstormed several possible analytical methods that can be implemented to develop the model:
Descriptive Analysis
Pareto Analysis - also known as an 80-20 analysis, can be employed on the various items recorded in ABC Company’s inventory. Given that there are over one hundred items listed, it would be impracticable to address each individual item during the course of this project. Thus, Pareto Analysis would allow us to prioritise which inventory items have greater impact on ABC Company.
The 80-20 split will be determined using several criteria: (1) cost and (2) usage pattern. For cost, the various inventory items will be ranked based on the cost, meaning that the items that make up 80% of the purchasing cost will be prioritised. For usage pattern, the items that are used with greater frequency and recurrence will be prioritised.
Inventory Demand Analysis
Like many businesses, the food and beverage industry is also subject to seasonal demand, meaning that consumers’ purchasing patterns fluctuate throughout the year and across years. Thus, this will be factored into consideration when developing the model. First, based on the data provided by ABC Company, transaction counts can be plotted over time to determine the pattern of seasonality. Transaction counts are a more accurate gauge of consumption pattern as opposed to revenue due to the tiered pricing structure that ABC Company practices (e.g. Adult, Child, Student/Senior Citizen), meaning that different combinations of customers could generate the same revenue as measured in dollars. Next, demand for each ingredient can be forecast by studying past usage and using this historical data to predict future consumption patterns.
Second, after determining the type of seasonality (e.g. additive, multiplicative, etc.), a combination of forecasting methods will then be applied.
Customer Count Forecasting Analysis
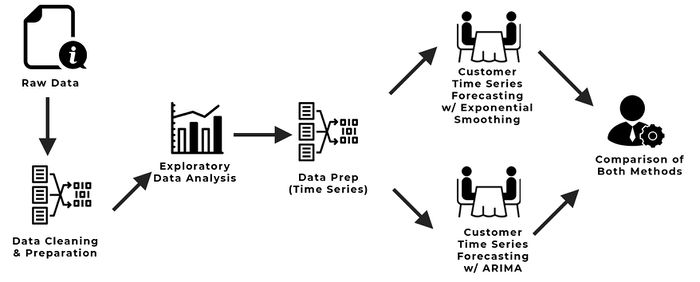
The food & beverage (F&B) industry is highly dependent on its customers for its success and sustainability. Being able to accurately forecast the number of customers patronising a restaurant allows the business to optimise their staff scheduling to provide the optimal customer service and experience. Customer count is also closely related to inventory consumption and can be used as rule-of-thumb guide for inventory ordering. This would ultimately translate to improved revenue and lowered costs for the business. To forecast the customer count for each of ABC company’s five outlets, we will perform time-series forecasting. Given that there are various Exponential Smoothing methods available for forecasting, we will first identify the best performing Exponential Smoothing methods and then compare them with ARIMA.


