ANLY482 AY2016-17 T1 Group1: HOME/Interim
Contents
Overview
SGAG is one of Singapore’s leading local humour content creators with the motto of “to make readers laugh at least 5 times a day, 365 days a year”. To achieve its motto, SGAG focuses their attention on creating engaging and interesting content in their daily posts. SGAG creates two types of content on their different social media platforms. These include paid advertisements and organic posts.
Over the years, many other local players such as SMRT Feedback and TheSmartLocal have joined SGAG to generate humour contents on social media. As such, SGAG would need to constantly improve their content generation strategy to maintain their competitive advantage. Through this project, SGAG would like to find out the factors affecting the performance of its Facebook posts, the characteristics of a great Facebook post, as well as the performance of its branded Facebook posts and Facebook video posts.
In order to perform the analysis, we have gathered one-year worth of data from August 2015 to August 2016. The mentioned data includes data extracted from SGAG’s Facebook insights and additional advertised posts’ data collected from SGAG. Our exploratory data analysis has been constructive to SGAG thus far and going forward, we will attempt to perform further analysis through classification models such as cluster analysis and latent model analysis.
Data Integration and Filtering
Extracted Table
Some columns in the original dataset were extracted to a new table as the original form does not serve to perform comparison analysis.
The figure above is a snippet of how lifetime likes by gender and age were stored in the original Page Level dataset. Lifetime Likes by Gender and Age stores an aggregated demographic data about the unique Facebook users who like SGAG's Page based on the age and gender information they provide in their user profiles. The original format does not allow a comparison of changes in daily likes of a gender by different age groups and also gained in daily likes.
Hence, we extracted the data into the following table and calculated the differences in daily likes in order to achieve our objective:
Challenges
The first challenge that team encountered was to perform a manual reconciliation of advertiser’s data to the post’s data (advertisement) as the information of the advertisers and the relevant posts to the advertiser were available via a dropbox link stored in another Microsoft Excel spreadsheet.
The second challenge is that a manual identification of video post’s data based on the source of the video. A video posted on SGAG’s page could be in-house generated (by SGAG) or Shared Video (by other Facebook Users/Public). The identification of the source depends on keywords and the characters appeared in the video. For instance, a video post is considered a shared video if the post message of the video contains words such as “credit to” or “submitted by” <name>. On the other hand, characteristics of an in-house generated video is when any of the SGAG characters appeared in the video (e.g. Xiao Ming, Sue-Ann). When a video does not possess any of the characteristics mentioned above, our team would have to confirm the source of the video with our sponsor, Mr. Karl.
Choice of Key Measurements
In our analysis, measurements such as Reach, Engagement, Impressions, Likes, Unlikes, Comments, Shares, Negative Feedbacks, and various length of Video Views have been chosen to be the key performance indicators. Measurements such as Lifetime Post Paid Reach and Lifetime Post Total Reach will not be used as performance measurements as there is no paid posts in SGAG’s dataset. Hence, the amount of organic reach would be the same as total reach and paid post reach will always be 0. As such measurements would be redundant and meaningless in our analysis, we have then excluded it from our analytical dataset.
Data Cleaning and Exploration
Issues
Several problems such as duplication of data, missing values and outliers can be found in the dataset collected from SGAG. As these issues will potentially affect the result of our analysis, suitable actions will be taken to handle such issues prior to performing our analysis.
- 1. Missing Values :
- After examining the dataset, a few missing values can be found at page level dataset, and no missing values are found at the post and video level dataset. As the missing columns in the page level dataset contains measures such as lifetime likes and daily demographics data that is critical in the evaluation of SGAG’s overall daily performance, these dates (26 January 2016, 28 & 29 August 2016) will be removed from our subsequent page level analysis.
- 2. Duplicate Values :
- There is no duplicate found at the page level data. However, a handful of row duplications and post message duplications can be found at both post and video level dataset. Some of the common issues found are as following:
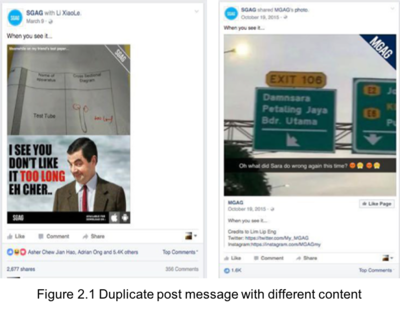
- i. Same Post Message with Different Content
- Figure 2.1 shows two posts that are described by exactly the same post message. After looking into the posts, we realized that both of the posts are of different content and therefore, will retain such posts in our further analysis.
- ii. Identical Rows
- As seen in Figure 2.2, various columns such as Post ID, Permalink and Post Message are the same across the two rows. Hence, we will remove one of the rows in our dataset for such situations.
- iii. Cover Photo and Timeline Photo Update
- Besides some of the common duplication issues mentioned above, we have also discovered that there are updates such as cover photo and profile picture update that result in the duplication of post messages. As this posts are only update of SGAG’s Facebook profile, they are not an indicator of SGAG’s performance and thus, will be removed from our further study.
- 3. Outlier :
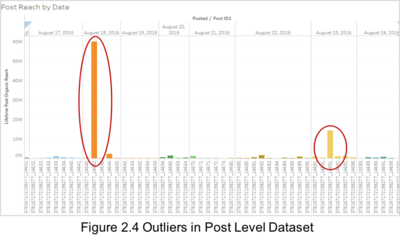
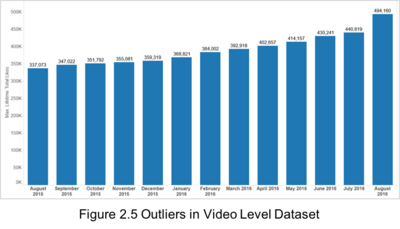
- Outlier in this project is defined as posts or dates that have significantly better or worse performance as compared to average SGAG Facebook posts’ performance. These posts go viral and perform exceptionally well due to certain special events such as the launch of Pokémon game in Singapore. As much as these posts generated high reach and engagement for SGAG, they are dominant and will potentially influence the results of our findings. Consequently, these posts will be excluded from our study. Figure 2.3, 2.4 and 2.5 below show the examples of outliers if page, post and video level data set respectively.
Exploration
Our team started off by looking at the changes in SGAG’s audience base from August 2015 to August 2016. Lifetime Total Likes is used to assess the growth or decline in their audience.
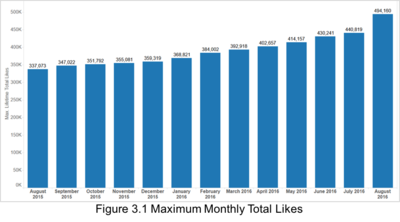
- Maximum Monthly Total Likes
- As seen in Figure 3.1, there is a consistent growth in SGAG Facebook Page fan from August 2015 to August 2016, with a rapid increase of over 50 thousand fan likes in August 2016.
- Changes in Daily New Likes and Unlikes
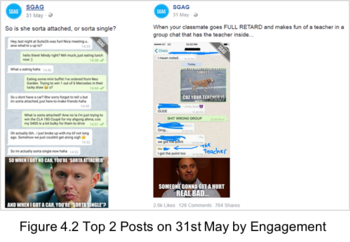
- The different dates with spike in SGAG Facebook page likes were on 4 February, 31 May, 21 & 22 June, 1, 20, 25 and 26 August 2016.
- In Figure 3.3, we can see an overlapping of dates between spikes in likes and unlikes. Although the trend change between likes and unlikes is similar, the number of unlikes make up to a small amount of likes gained. 2,319 likes were gained with 106 unlikes on SGAG Facebook Page on 4th February 2016. The changes in unlikes amounted to only 4-5% of the number of likes gained on those overlapping dates. We will further look into the different posts on those dates to know the different types of post that attracts the most audience or turns the audience away.
- A “Like” from a new fan indicates their interest in receiving SGAG’s posts in their newsfeed. As there are different target groups, we will examine SGAG Facebook Page performance in reaching out to the fan. To achieve the objective, we will look into the demographics of SGAG’s fan to know which gender and age group form a larger audience base.
- Changes in Monthly Likes by Gender and Age Group
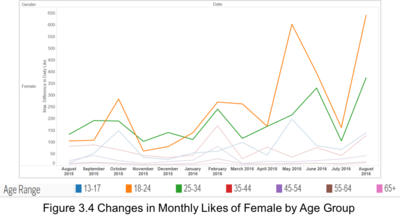
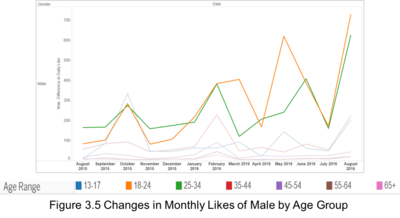
- As seen in Figure 3.4 and Figure 3.5, age group 18-24 for both male and female continue to be the largest audience of SGAG’s, followed by age group 25-34. These 2 groups are particularly more reactive towards SGAG’s posts whereas there is only a slight improvement or unchanged in other age groups’ interest. Teens aged 13-17 are more active on other social media such as Instagram and Snapchat. Middle-aged adults and elderly are less active on social media. Findings were highlighted to SGAG and SGAG commented that their posts are targeting more on these 2 age groups.
Findings
Page Level
Revisiting the spike in daily likes and unlikes, we will now explore into the different types of post on the different dates shown in Figure 3.2 and 3.3.
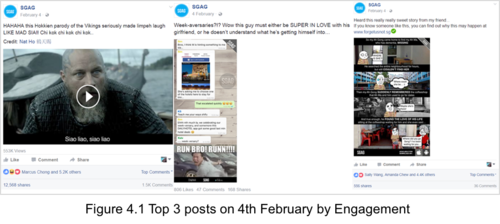
As discussed with SGAG, reach is used to measure the post’s performance in reaching out to Facebook users. Figure 4.1 shows the top 3 posts on 4th February based on number of users engaged. The first post is a funny video from Vikings which engaged 207,756 Facebook users. The second and third post are related to relationship (couple/family). Despite its higher engagement, a total of 113 negative feedbacks1) were associated with the video by Vikings.
1) Negative feedback happens when a Facebook user clicks hide post, hide all posts from the subscriber, unlike the page and report as a spam.
The similarity between the two posts is that both posts were humorous conversations. The first post engaged 218,415 Facebook users and the second post engaged 102,582 users. Although the two posts have high engagements, they did not obtain high negative feedbacks.
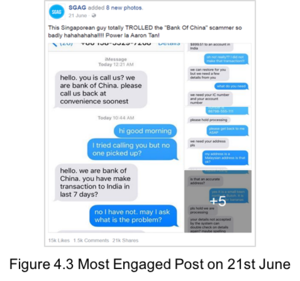
A series of 7 continuous humorous conversation pictures engaged over 700 thousand Facebook users with 5,000 comments, 51,000 likes, 21,000 shares and 146 negative feedbacks on 21st June. There was also a spike on the following day, however the engagement rate associated with the posts of the day were not very high. When a user “Likes, Comments, or Shares” on this post, it might result in this post appearing in other Facebook users’ newsfeed or ticker. Hence, our team suggested that this post may be the main contributor to the spike on 22nd June due to its high engagement, as the other posts on 22nd did not drive large engagement, likes, comments or shares.
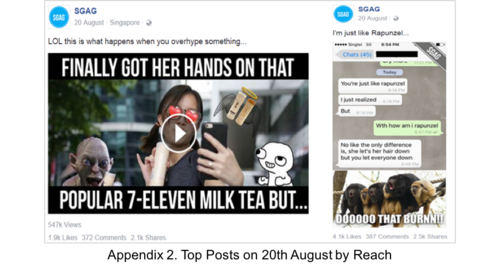
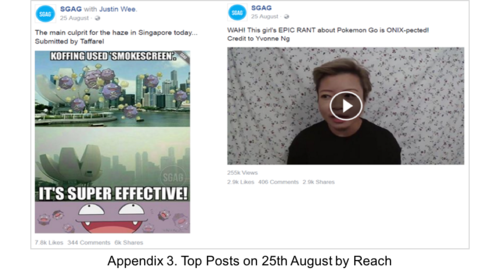
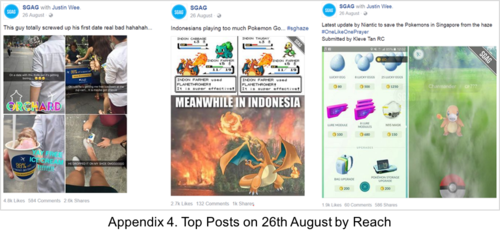
As for other days with high increase in likes, the posts were mainly related to the latest trending or news such as the popular Taiwan milk tea selling at 7-11, Pokémon, and Haze (Refer to Appendix 2 and 3 in Interim Report).
Post Level
Reach by Post Type
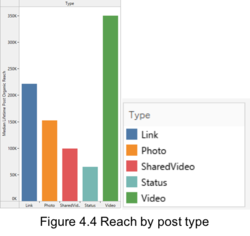
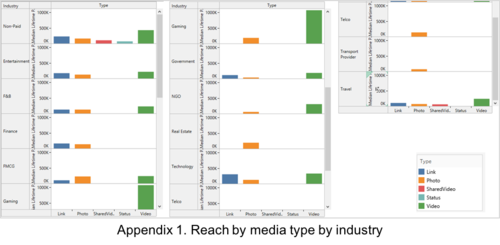
From Figure 4.4 above, we can see that on average, video posts generated notably better performance as compared to the other media type. This observation still holds for most industries even when we drill down the analysis to individual advertiser’s industry level (Appendix 1).
Comparison of the Performance of Paid and Unpaid Post
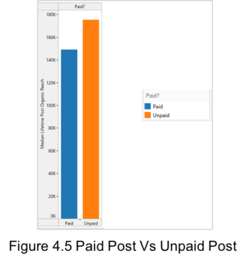
By looking at post reach of paid and unpaid posts, unpaid posts generally perform better as compared to paid posts. Unpaid post performance is 14.93% better than paid post performance. This may be due to the nature of paid post being more relatable and humorous. Hence, SGAG may consider to craft paid posts in such manner to help in generating more reach for paid posts.
Reach of Paid Post by Industry
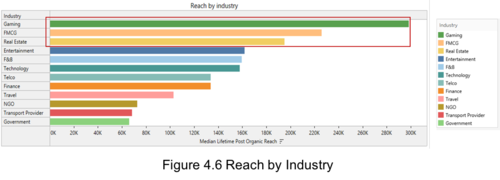
From Figure 4.6, the top 3 best performing advertiser’s industries are Gaming, FMCG and Real Estate. However, upon further investigation, some of the advertiser industries do not actually place a lot of advertisements with SGAG. For instance, the top performing industry which is Gaming, only contain 1 advertiser. As such, these industries may have high performance due to its low number of advertisers and advertisements. To better gauge the performance of the advertiser’s industries, we excluded industries which comprise of only 1 advertiser and as seen in Figure 4.7, the result was significantly different and the top 3 best performing industry will then be FMCG, Entertainment and F&B.
Top Posts with Most Reach
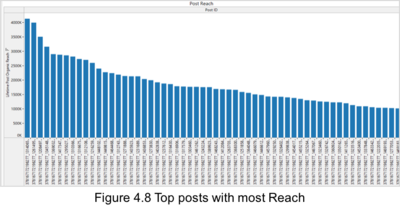
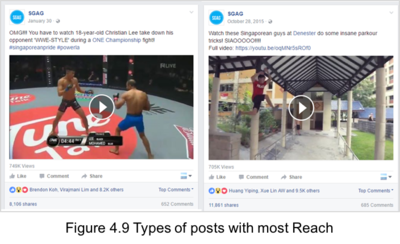
Based on our discussion with SGAG, Reach is an important factor in deciding the performance of a post. Higher Reach indicates that the post is seen by a larger audience base. Hence, examining the top posts with most reach will allow us to know the different types of post that attracts the most audience. Figure 4.8 illustrates the Top Reach generated by SGAG Facebook posts over the past year. The top performing post reaches over 4 Million audiences which is 8 times the total likes of SGAG Facebook page. Meanwhile, Figure 4.9 shows us the different type of posts that generated the highest reach. These posts are relevant to the current happening events or trends, as well as related to the pride of Singapore.
Top Posts with Most Engagements
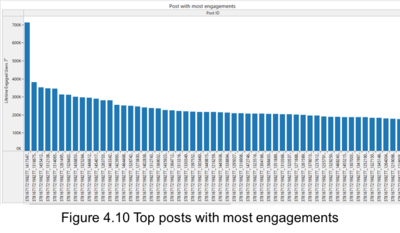
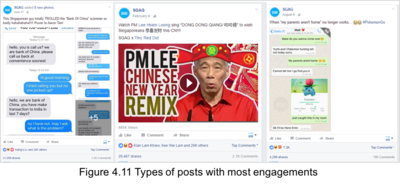
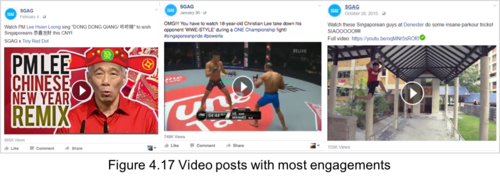
Posts with most engagements are posts that generate discussion amongst the audience, these posts spark the interests of the audience, such that people keep interacting with the posts and share it to their friends. Engagements allow the post to reach out to the friends of people that are interacting with the posts and thus, will potentially generates higher reach. Hence, engagements of a post are also an important indicator of the post’s performance. Figure 4.10 depicts the posts with top engagements, while Figure 4.11 represents the instances of such posts. While the 3 posts shown in Figure 4.11 are of different topics, a noteworthy observation is that all of the 3 posts are considered as humorous posts.
Posts with Most Negative Feedbacks
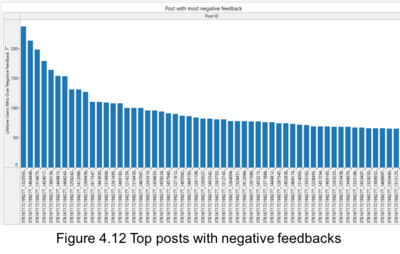
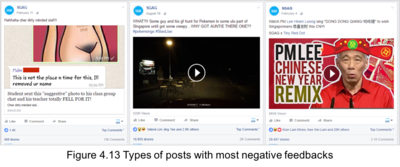
As seen in Figure 4.12, the amount of negative feedbacks received from SGAG’s audience are not very significant, most of the posts received lesser than 100 negative feedbacks and the post with most negative feedbacks received 237 feedbacks. While the figure of negative feedbacks is not as noticeable as compared to the number of engagements and reach that SGAG have, posts with negative feedbacks are able to show SGAG the type of posts that people dislike and will be able to help them in deciding what kind of Facebook post to craft in the future. From Figure 4.13, the post with most negative feedbacks features a picture that is perceived as indecent, while it is actually a dog cartoon character. The reason of why this specific post generated highest negative feedbacks among all the posts this past year may be due to the preview picture deemed inappropriate to be shown in social media platform like Facebook as kids of any age will be able to enter the social media platform easily. It is important to note that the next two posts with most negative feedbacks are also posts with relatively high reach and engagements. This is because popular posts appear frequently on people’s timeline and some may find it annoying and repeating. Hence, decided to hide it away from their timeline. As for the last post on Figure 4.13, while most people find it funny, others may see the video as disrespectful act towards our Prime Minister, Mr Lee Hsien Loong, this results in higher negative feedbacks in this post.
Video Level
For the video analysis, we will exclude the videos shared by Facebook users to SGAG’s timeline as it is not part of the performance measurement of SGAG’s video posts. We will examine the performance of click-to-play and auto-play video by the length of video view. There are 3 different measurements for the length of video view:
- “Video view” in which a video was viewed for more than 3 seconds
- “30-seconds view” in which a video was viewed for more than 30 seconds or to the end, whichever came first
- “95% views” in which a video was viewed to 95% of the video length
Top Video Posts for Auto-Played
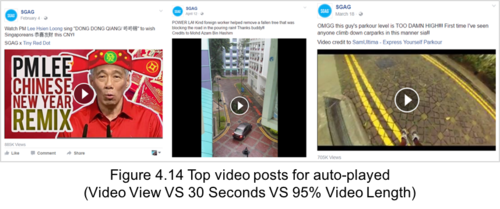
Figure 4.14 shows the top posts for auto-played video based on number of times the video was played, the top post for video view (left), 30-seconds (middle) and 95% view (right).
The video of our Prime Minister, Mr Lee Hsien Loong has the highest number of played times at 687,560. The top video for 30-seconds view shows a helpful foreign worker in removing a fallen tree and this video has been played for 341,146 times. The video of parkour depicting a climbing manner down in a carpark, and it has been played for 293,602 times.
The theme for the 3 videos are as follow: the video of PM Lee is funny and cheering, the second video shows a helpful and kind foreign worker and the parkour video shows a training technique aiming to overcome obstacles which is trending among the youngsters. Although the theme appeared to be different, the length of the 3 videos were all at around 40 seconds.
Top Video Posts for Click-to-Play
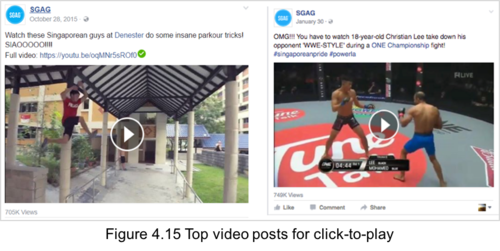
The 2 posts shown in Figure 4.15 were identified as the top posts championing the number of played times, for video view, 30-seconds view as well as 95% view. The video depicting “cool” parkour tricks and it was played 205,961 times, 178,346 times and 153,713 times for video view, 30-seconds view and 95% view respectively.
The video of Christian Lee (on the right) also attained high number of plays across the 3 different views measured. The video of our Prime Minister, Mr Lee Hsien Loong was another video with higher number of plays for video view and 30-seconds view. The 3 top videos identified share common similarities, for which the 3 posts are related to current happening or trending in Singapore, as well as Singaporean spirit and pride.
Video Retention Rate
Video Retention Rate in our analysis is described as the percentage of video viewed on average. The measurement of average video view gives an overview of audience retention on a specific video post. This information provides SGAG a better understanding of video length to audience retention.
In our analysis, we found out that on average, videos shorter than 35 seconds are viewed for longer. However, this figure only serves as a gauge to an “optimal” video length based on audience’s attitude. The actual performance of a video still largely depends on the interesting content of the video.
Video Retention for Top Video Posts in Auto-Played and Click-to-Play
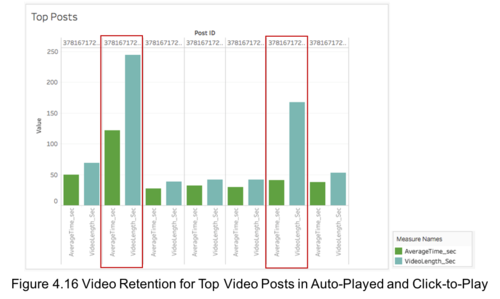
Of the top video posts identified in Auto-Played and Click-to-Play, we would like to examine whether the length of the more popular videos result in longer audience retention.
Our analysis in Figure 4.16 shows that there is no correlation between the popularity of a post and average view length. A post may have very high number of plays but low average video view if video length is too long. This can be seen from the highlighted part of Figure 4.16, the 2 popular posts with longer video length have lower average video view. On the other hand, posts with shorter video length have lesser gap between the average view and its actual length.
Video Posts with Most Engagements
Figure 4.17 shows the 3 video posts with most engagement. The post showing Chinese new year greetings remix of our Prime Minister, Mr Lee Hsien Loong has the highest number of engagement at 380,919 followed by Christian Lee post with 345,529 and parkour video with 312,119. The top 3 video posts as mentioned above, are more related to the current trends in Singapore or Singaporean’s pride. As a result, they are discussed among the audience.
Video Posts with Most Viewership
Viewership in our analysis is defined as the percentage of impressions that translated into views (total video views/total impressions generated). In analysing the performance of videos, it is crucial for us to measure the conversion percentage as it allows us to analyze the factors that impacts the percentage of users who decide to watch the video. These factors may include post message, preview thumbnail and content at the beginning of the video.
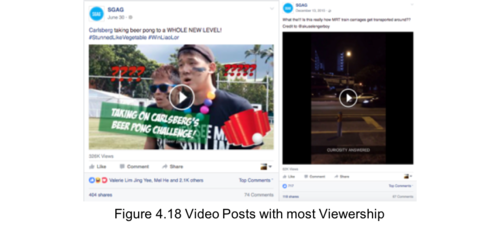
The 2 posts shown in Figure 4.18 were the top posts with most viewership in both auto-played and click-to play category. For auto-played category, the video (on the left) that features beer pong challenge has a viewership of 76.15%. As for click-to-play, the video was about transporting of MRT train carriages and it achieved a viewership of 85.81%.
The content at the beginning of the beer pong video plays a huge role in the viewership conversion, the game was entertaining and exciting at the beginning, that it is able to retain its audience. Meanwhile, the title of the second post which is “What the!!! Is this really how MRT train carriages get transported around??” was attractive and relatable to most audience, that it attracted the audience to watch the video and find out how are their daily commuting transportation being transported around.
Video posts with Viewership for 30 Seconds
After finding out the viewership for each video, we analysed the number of viewers that watched 30 seconds of the video or watched till the end of the video. With this, we can have a rough idea on how engaging the video content is, that it drives the audience to continue watching the video.
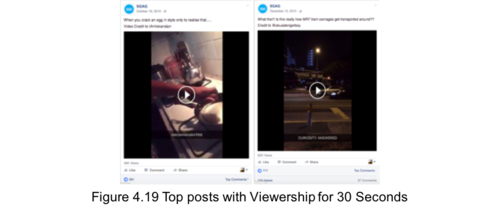
The 2 posts shown above in figure 4.19 represent the top video posts with 30 seconds viewership for both auto-played category (left picture) and click-to-play category (right picture). Top video for auto-played category which shows cracking of eggs achieved a viewership of 89.69% while that for the click-to-play category which features train carriages transportation gained a viewership of 85.81%.
Revised Methodology
As mentioned previously in our proposal, Cluster Analysis and Sentiment Analysis have been chosen as our main methodologies used in analysing the dataset. However, due to the time constraint, our team will be focusing more on understanding the behaviour and factors contributing to popular Facebook posts and thus, will not attempt to interpret the sentiments of SGAG’s Facebook comments and Twitter tweets through Sentiment Analysis and Text Mining. Going forward, our team will be focusing on using classification models such as cluster analysis and latent analysis to understand the behaviour of SGAG Facebook posts.
Cluster Analysis
Our team will attempt to use K-Means Clustering to find out the characteristics of SGAG’s Facebook posts that perform similarly. Firstly, Cluster Analysis provides us a more dynamic way of classifying SGAG Facebook posts. Cluster Analysis allows us to use different attributes to group the Facebook posts and this will give us a more comprehensive grouping of the posts as it is not just based on a single performance indicator, but many different attributes.
Secondly, by using K-Means Clustering, we will have the flexibility of experimenting with different K-Values. This gives us the ability to find out the optimal number of clusters that can best describe the performance of SGAG’s Facebook posts. In this Cluster Analysis, our team will attempt to examine the behaviour of SGAG Facebook posts at both the general post level itself and at the specific video level. Thereafter, we will attempt to examine the reasons affecting the performance of each cluster.
Latent Analysis
As much as Cluster Analysis is useful in helping us to classify SGAG’s Facebook posts, there is a limitation to Cluster Analysis as well. A noteworthy restriction of Cluster Analysis is that it can only accommodate continuous variables. Nevertheless, there are several categorical attributes in our dataset that may be useful in classifying SGAG’s Facebook posts or videos. As a result, our team will attempt to make use of Latent Analysis which allows us to leverage on the categorical variables of our dataset in describing the groupings of SGAG’s Facebook posts.
While Cluster Analysis finds cluster using distance measure such as Euclidean distance between two objects, Latent Analysis attempts to use a model to describe the distribution of our dataset and assesses the probability of each object belonging to certain group. It is a more Top-down approach as compared to Cluster Analysis. In addition, Latent Analysis also captures more uncertainties in the process of classifying the posts as it does not categorize each posts by group but rather, gives us probabilities of each post belonging to each groups.
For the different datasets, our team will firstly examine the types of variables that will be useful in classifying the particular dataset. Then, we will attempt to classify the dataset objects using either Cluster Analysis or Latent Analysis for each of the datasets. By obtaining the different clusters through these two classification models, our team will be able to assist SGAG in reviewing the performance of the different type of posts and improving the quality of their posts
Revised Work Scope
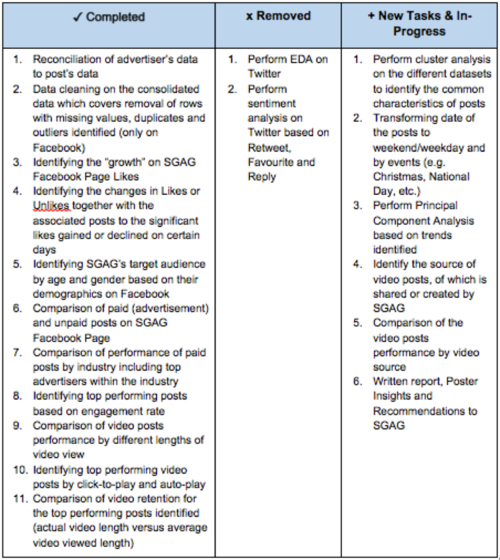
The original work scope includes analysis of SGAG’s digital media performance on Facebook and Twitter. There are 3 different levels of analysis on SGAG’s Facebook insights, namely: Page, Posts and Video. In addition, to better understand the performance on Twitter, crawling of tweets and retweets from SGAG’s Twitter followers are needed to perform sentiment analysis. However, given the amount of data and variables that we have to analyse on Facebook and the time constraint, Prof. Kam suggested our team to focus on analysing SGAG’s content performance on Facebook.
Following shows the breakdown of our work scope as of interim:
Revised Work Plan
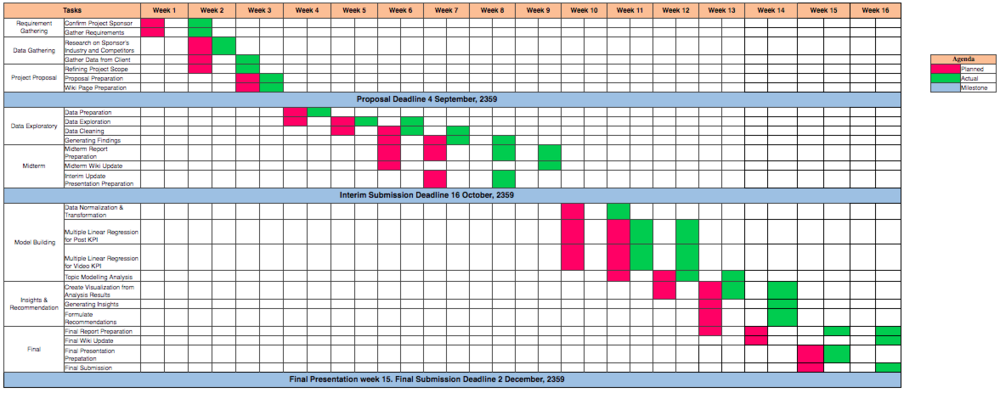
Following is our revised work plan as of interim:
Firstly, sentiment analysis has been removed from our plan due to the amount of data and time we have. In addition, Principal Component Analysis and Latent Analysis have been added to our work plan to provide better analysis of the datasets. In the following 5-6 weeks, we will attempt to build our classification model, as well as, generate insight and recommendations for SGAG and finalize our project.
Appendix


