Group10 proposal
Contents
Background
Having an accurate housing price model is important for the government or policymakers as properties plays a significant role in household wealth and national economy. To date, the hedonic pricing model is still the commonly used method by researchers to study housing prices. Hedonic pricing models are often computed using an ordinary least squares (OLS) estimator, with the assumption that the observations are independent and identically distributed. This indicates that there is no spatial auto-correlation among the observations but in reality, that might not be true and thus, a hedonic pricing model could lead to biased, inconsistent and inefficient results. Moreover, when new developments are launched, the developers dictate the prices. Our team attempts to understand the price variation for new launches.
Our team attempts to explore the use of various statistically methods to provide insights to the property transnational data.
Our team attempts to explore the use of geographically-weighted regression (GWR) as a property pricing model and thereafter compare to see which is better. The research findings can help us understand the roles of various structural attributes and locational amenities in estimating property prices.
Motivation
Since prices of new launches are always determined by the developers, our team will like the explore the changes of the property prices as the phases, time, progress and the range of the property.
As for the resale market, we will like to explore the price range of property in similar areas and what accounts for the price differiences.
Project Objectives
The objectives of the project are as follows:
1. To find out how developers price their launches;
2. To estimating property prices in the various vincinity;
3. To understand the extent to which each attributes affect the property prices around different areas of Singapore;
4. To visually represent our findings.
Proposed Scope and Methodology
We will confine our work to the private housing market in Singapore. This is because HDBs has many restrictions imposed and therefore to some extent, its prices are controlled. In contrast, the private housing market is open to all buyers and therefore can be more accurately determined by the attributes of the property and its surrounding.
The surrounding amenities we will consider in our project are Schools, MRT, Bus Stops etc.
Methodology will be linear regression and geographically weighted regression
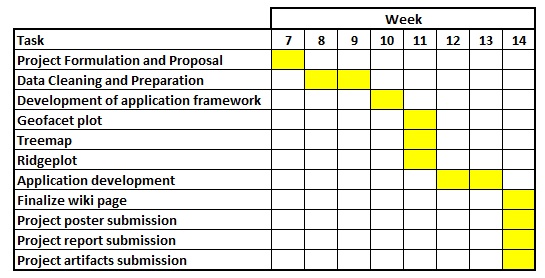
Project Timeline
Features
Our visualisation will use the Singapore Map with the following features:
- Breakdown into small areas according to ???
- Colour coded according to the degree of R-squared value
- User option to select which attributes to look at?
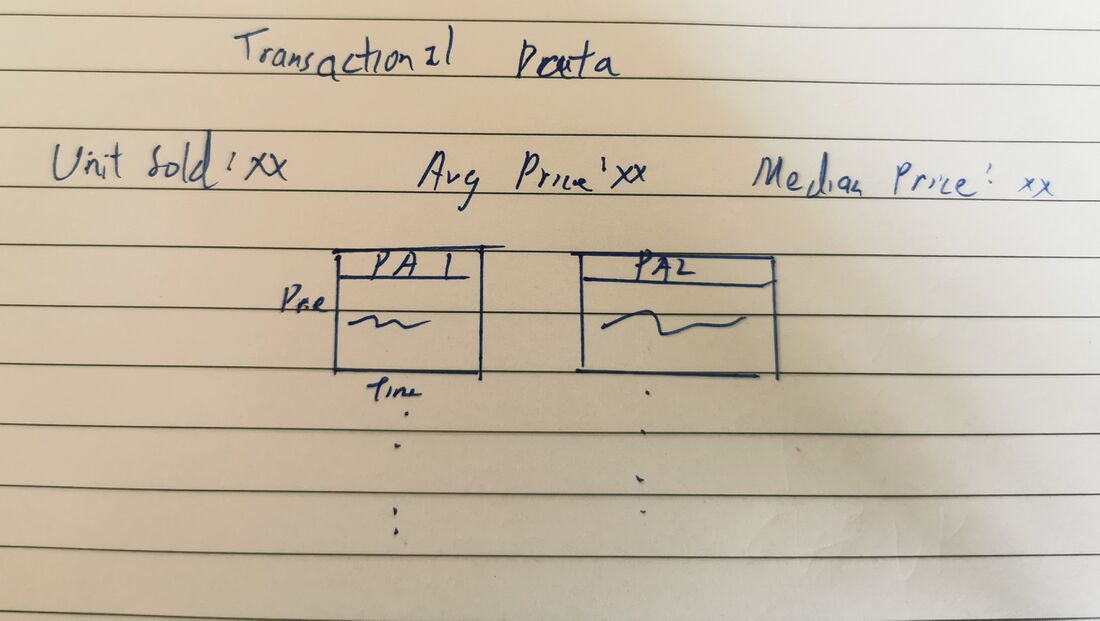
An example of our visualisation:
Data Source & Preparation
We will use REALIS data, 2018 & 2019, for our project.
| Data Source | Documentation |
|---|---|
| Realis | Transaction Data of Private Property in Singapore |
Software
Packages
| Package Name | Description |
|---|---|
| Shiny | Building of interactive web applications |
| Shinydashboard | Dashboard Creation |
| ShinyThemes | Themes for Shiny |
| ShinyWidgets | Themes for Widgets |
| RColorBrewer | Provide color schemes |
| Tidyverse | Collection of R packages for data analysis, packages includes ggplot2, dplyr, tidyr, readr, purrr, tibble, stringr, forcats |
| Lubridate | Working with date and time |
| Geofacet | Visualize data by geographical regions |
| Treemap | Visualize data as nested rectangles |
| ggstatplot | ggplot with detailed statistical test |
| Ridgeplot | Visualize data as ridgeplot |


