Group10 proposal
Contents
Background
The Urban Redevelopment Authority (URA) has a database of accurate information on all private property transactions in Singapore. Although widely informative with data on property type, location, transacted amount and sale date, they are published in tabular form as a listing of records with limited or no analytical function available to transform these data into useful information.
To overcome this issue, we designed and developed SPIVA, Singapore Property Interactive Visual Analytics Dashboard, to democratise data and analytics by allowing casual public users to explore and analyse Singapore private property data to gain valuable insights about Singapore property market price trends.
Motivation
Our research and development efforts were motivated by the general lack of effective and easy to use web-enabled client-based analytics tool for discovering Singapore property price trends. It aims to provide
users with an analytical tool for discovering insights to Singapore property prices through easy-to-understand visual analytics charts by democratise data and analytics by allowing casual public users to explore and analyse Singapore private property data to gain valuable insights about Singapore property market price trends. Specifically, it attempts to support the following analysis requirements:
1) To visualise price changes in different areas of Singapore over time;
2) To compare the price range and transaction volume of different areas of Singapore;
3) To identify if the average unit price of a private property project is above or below the average unit price of the planning area and its extent of differences;
4) To enable users to perform statistical analysis on the price distribution of different property types and regions in Singapore.
Project Objectives
The objectives of the project are as follows:
1) To find out how different planning area behave with regards to price and number of transaction;
2) To find out the difference between property type, type of sale and between the 2 years;
3) To understand the extent to which area has on the price;
4) To visually represent our findings.
Proposed Scope and Methodology
We will confine our work to the private housing market in Singapore. This is because HDBs has many restrictions imposed and therefore to some extent, its prices are controlled. In contrast, the private housing market is open to all buyers and subjected to market forces.
Our team will be exploring the prices and transaction volume to generate insights.
We adopt the following steps to complete our project.
| Step | Procedure | Description |
|---|---|---|
| 1 | Data Preparation | Familiarise ourselves with REALIS dataset and study its variables to decide what useful insights we want to show in our application. |
| 2 | Sketch of DataViz | Discuss the chart type to use for each insights and sketch our its components. |
| 3 | Choose R Packages | Search for the appropriate R packages and understand its parameters in CRAN. |
| 4 | Build DataViz in R | Develop the visualisation in R which involves data transformation, coding and debugging. |
| 5 | Gather feedback and iterate | Comsult with Professor Kam for feedback and iterate on the design. Team mates will also provide their feedbacks to each other on an on-going basis. |
| 6 | Intergrate into Shiny App | Once finalised, application to be integrated into Shiny App. Adding features in UI and Server. |
| 7 | Improve aesthetic | Install shinydashboard to improve the aesthetic of the application and make it more pleasing to the eyes. |
| 8 | Deploy to Shinyapps.io | Create a shinyapps.io account and deploy online. |
Data Source & Preparation
We will use REALIS data, 2018 & 2019, for our project.
| Data Source | Documentation |
|---|---|
| Realis | Transaction Data of Private Property in Singapore |
Features
Our visualization contains the following features:
| Main Feature | Sketch of DataViz |
|---|---|
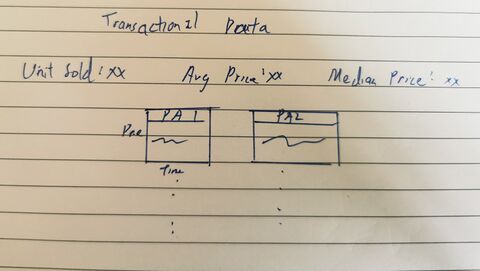
| 1) Overview of Singapore's private property by Planning Area using "geofacet" with HUD i) HUD to display overall Units Sold, Mean Price, Median Price |
|
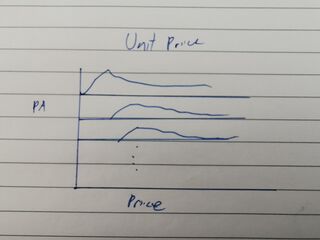
| 2) Ridges Plot i) Variation of price and transaction volumne comparison of planning areas and districts |
|
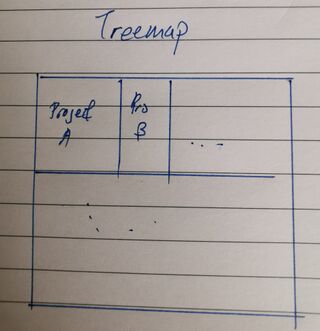
| 3) Treemap i) Property price difference of specific projects compared against the mean or median price of the planning area |
|
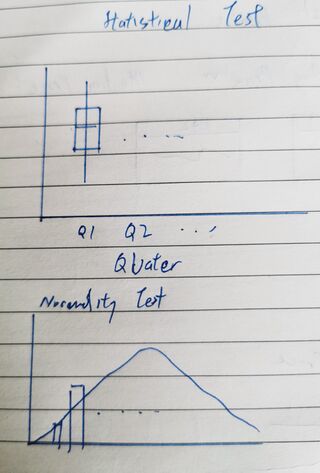
| 4) Statistical test for the price i) Anova plot for prices between Quarters |
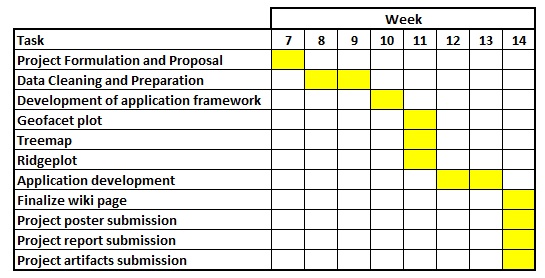
Project Timeline
Software
Packages
| Package Name | Description |
|---|---|
| Shiny | Building of interactive web applications |
| Shinydashboard | Dashboard Creation |
| ShinyThemes | Themes for Shiny |
| ShinyWidgets | Themes for Widgets |
| RColorBrewer | Provide color schemes |
| Tidyverse | Collection of R packages for data analysis, packages includes ggplot2, dplyr, tidyr, readr, purrr, tibble, stringr, forcats |
| Lubridate | Working with date and time |
| Geofacet | Visualize data by geographical regions |
| Treemap | Visualize data as nested rectangles |
| ggstatplot | ggplot with detailed statistical test |
| Ridgeplot | Visualize data as ridgeplot |

