Difference between revisions of "Project Groups"
| Line 95: | Line 95: | ||
* [[Group03_poster|Poster]] | * [[Group03_poster|Poster]] | ||
* [[Group03_application|Application]] | * [[Group03_application|Application]] | ||
| + | * [[Group03_user_guide|User Guide]] | ||
* [[Group03_research_paper| Research Paper]] | * [[Group03_research_paper| Research Paper]] | ||
|| | || | ||
Revision as of 14:50, 25 April 2020
|
|
|
|
|
|
|
Please change Your Team name to your project topic and change student name to your own name
| Project Team | Project Title/Description | Project Artifacts | Project Member |
|---|---|---|---|
| Group 1 |
Market Basket Analysis Market Basket Analysis (MBA) is one of the key techniques used by large retailers to uncover associations between products brought by consumers. In our case, we apply a sequential version of MBA, called “sequential itemset mining” or “sequential pattern mining”, to analyze whether buying one item in the past indicates a higher likelihood of buying other things in the future. For instance, whether purchasing peanut butter implies sales of bread in the near future. |
| |
|
A Visual Exploration of Media Consumption in Singapore Government communicators’ real-world experience of using survey data to better understand their audiences falls short of ambition. The analytics practices of market research firms goes some way to explaining why this gap persists. This project aims to provide government communicators with a user-friendly web-enabled application to visually discover the media consumption patterns and behaviours of major audiences in Singapore. Untapped insights from survey data can be revealed by encouraging deeper interaction through this interface. |
| ||
|
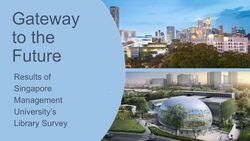
Gateway to the Future
|
| ||
| Group 4 |
China Happiness Analysis The Chinese General Social Survey (CGSS) began in 2003 and is the earliest national, comprehensive and continuous academic survey project in China. The CGSS system comprehensively collects data at multiple levels of society, community, family, and individual, summarizes the trends of social change, discusses issues of major scientific and practical significance, promotes the opening and sharing of domestic scientific research, and provides data for international comparative research Data, serving as a multidisciplinary economic and social data collection platform. |
| |
| Group 5 |
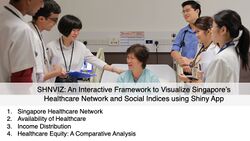
SHNVIZ: An Interactive Framework to Visualize Singapore’s Healthcare Network and Social Indices using Shiny App Singapore has experienced significant economic growth since its independence, however, there are growing signs of social inequality and deterioration of societal well-being. Singapore’s ageing population resulting in a decreasing economic dependency ratio has placed a significant burden on the healthcare system. In this project, we focus on healthcare as our primary measure of well-being and developed a series of visualisations to further investigate the status of healthcare equity and availability in Singapore. We will conduct geospatial analysis, linear regression models, associative scatterplots together with exploratory visualisation such as faceted bar charts and heatmap. The highly interactive visualisations are hosted on R Shiny Web Application which allow for the manipulation of charts and graphs so as to uncover insights that would enable policy-makers to answer questions pertaining to the demand-supply dynamics of meeting healthcare needs and pinpoint locations where infrastructural gaps may exist. |
| |
| Group 6 |
ATMs by Spar Nord in Denmark With banks transforming digital, there is less demand for cash. As reported by Mckinsey, in Denmark where electronic instruments have driven cash usage below 40 percent, banks are facing a constant challenge to reduce the fixed cost of ATM networks and the high manual cost of cash in operations, distribution, maintenance, and processing. In this project, we will use data visualization techniques to map out the ATMs location, volume of transactions, frequency of transactions. We will apply several data analysis techniques to analyze the utility of the ATMs. |
| |
| Group 7 |
Cryptocurrency Portfolio Selection As of March 2018, there are 1,658 cryptocurrencies in existence. The total cryptocurrency market capitalization is just under $369 billion. With the help of cryptography and a collective booking system called blockchain, cryptocurrencies build a distributed, safe and decentralized payment system, which does not need banks, intermediates, an organization or a central technical infrastructure to work. However, mainly due to lack of regulatory support, Cryptocurrencies are highly volatile, which makes it a risky investment. Therefore, in this project, a Shiny web application is created with the cryptocurrency analysis in mind. It integrates three types of analysis: Time Series Analysis, Correlation Analysis and Portfolio Selection Analysis within one application. This application is made to be informative and allows potential investors of cryptocurrency to interact with the data embedded within the application, view the visualization and generate results based on the selected filters before they make decision on cryptocurrency investment. |
| |
| Group 8 |
Re-imagining Bus Transport Network in Singapore Singapore's public transport use rose to hit a record high in 2018, with a total of 7.54 million trips made on buses or trains each day. Here's what may come across your mind: Do you ever have experiences where a bus ride that is supposed to be short and quick took way longer than expected? Are you frustrated that the bus stops at every stop even though there’s nobody boarding or alighting? And why do we have so many bus stops that almost nobody uses? What if we can reimagine the public bus network in Singapore through data? In this project, we will use data visualization techniques to map out all transportation nodes in Singapore and re-propose a different way of organizing our bus services, which include bus stops, bus routes, and connectivity within region and from regions to regions. |
| |
| Group 9 |
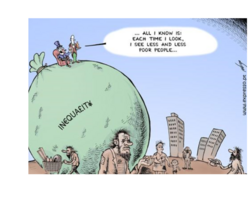
Poor In Wealth , Poor In Health ? Income equility is a hot issue these years,many sub-topics have been derived from this theme.Scholars have studied about the rootcause that result in this situation,the post-impact of income inequility and so on.Our project is to explore the relationship between individual income inequility and health.It will be a extension study of a existing work,published by Bakkeli, N., Income inequality and health in China: A panel data analysis. CHNS(China Health and Nutrition Survey) offer good resource for us to explore the income inequility problem in China,with more than 10 years data.Beyond original work scope,we will involve updated survey data to show the result.Besides,China context-income inequility gap among regions,will also be taken into consideration when conducting the analysis.The final result will be presented in a interactive visualization view. |
| |
| Group 10 |
SPIVA: A Singapore Property Interactive Visual Analytics Dashboard URA has done a great job at providing us with accurate data of all the private properties transaction in Singapore. However, many users use these data at a transactional level and thus does not bring out the full value of what the data tells us. Moreover, user might lack the analytical knowledge or tools to perform in depth analysis on these data. To overcome this issue, we designed and developed SPIVA, Singapore Property Interactive Visual Analytics Dashboard, to democratise data and analytics by allowing property marketplace stakeholders to explore and analyse Singapore private property data to gain valuable insights about Singapore property market price trends and expectations. |
| |
| Group 11 - LRT |
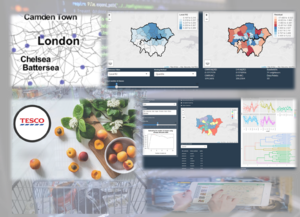
A Geospatial Analysis on Nutrients & Obesity in Greater London Using TESCO grocery data, we will present a link between nutrients from food purchases in Greater London to a number of geographically-salient indicators. Segmentation using both aspatial and geospatial clustering techniques are deployed in a R SHINY application. The application would also allow exploratory techniques like Geographically weighted regression (GWR) to facilitate visualisation of the nutirents information. Simple Feature (SF) data are used at 4 levels (LAD, Ward, MSOA, LSOA) in this user interactive application. |
| |
| Group 12 |
Global Warming, Global Warning! Global warming is an ongoing problem, and for a long time scientists have sounded the alarm about taking action to slow it down. Meanwhile, the situation continues to deteriorate. Rising temperatures have led to rising sea levels, changing rainfall patterns and more frequent extreme weather. Recent severe fires in Australia and locust plagues in Africa have been linked to droughts caused by warming temperatures. It is well known that the main cause of global warming is the massive use of fossil fuels (such as coal, oil, etc.) for nearly a century, which emits a large amount of CO2 and other greenhouse gases. These greenhouse gases absorb infrared light from the radiation emitted by the earth, causing the earth's temperature to rise. This project aims to let everyone know the trend of global warming and the emission of carbon dioxide in various countries, so that everyone can attach importance to this problem. |
| |
| Group 13 |
Visualization of Human Development Data In every corner of the world, people wish to live a life with greater prosperity. Well, if a dream can come true, it won't be called a "dream" anymore. For many people in many countries, a dream will always be a dream. From time to time, we hear melancholy stories telling the life of people who live on the sideline of society. |
| |
| Group 14 |
Customer Attrition Prediction and Visualization
|
| |
| Group 15 |
COVID-19 Diffusion Visualization Since December 2019, new cases of COVID-19 have been discovered in Wuhan, it has spread to all over China and other countries. As of 2019-03-01, a total of 79,971 cases have been diagnosed and a total of 2,873 deaths have been confirmed in China. The situation in the rest of the world is not optimistic, 7,277 cases have been confirmed and the total 18 deaths occurred in other countries. Its widespread and rapid speed is alarming. The 2019 nCov has caused a certain impact on the economy of China and even countries around the world, even has been taken seriously by WHO. In order to study trends in number of diagnoses, the number of suspected patients, and deaths over time for different areas, we use the 2019 nCov data for further analysis and visualization. |
| |
| Group 16 |
Think before we eat meat Meat is almost on every table across some developing and most developed countries. And it seems that we shall have more meat in the future. But is this true? Our team wish to have a close look to the global meat market, including production, consumption and trade to answer the question. |
| |
| Group 17 : Detectives |
Armed Conflicts in South Asia With the persistent existence of armed conflicts, it is important to understand the behavior of these events and how various factors impact the intensities of these events. This project aims at delivering an R shiny app that first provides a basic understanding of the nature of the armed conflict events, e.g. the different types of armed conflicts, the intensities in different countries in south Asia, and time series analysis to visualize the evolution of the armed conflicts with the impact in terms of fatalities over the period of 2016-2020 in South Asia. |
|

