Difference between revisions of "Group01 proposal"
| Line 33: | Line 33: | ||
'''Market basket analysis''' is a type of data mining technique to find association rules between different objects in a set, find frequent patterns in a transaction database, relational databases or any other information repository.<br> | '''Market basket analysis''' is a type of data mining technique to find association rules between different objects in a set, find frequent patterns in a transaction database, relational databases or any other information repository.<br> | ||
| + | === Application of Market Basket Analysis === | ||
This is often used in retail services to understand the products that are being purchased together. This would help the companies in designing their cross-sell or up-selling strategies. For example, assume product A has a relatively higher profit margin and it is often purchased together with product B. The company could bundle these two products to increase the sales of the products in order to increase its profit margin. <br> | This is often used in retail services to understand the products that are being purchased together. This would help the companies in designing their cross-sell or up-selling strategies. For example, assume product A has a relatively higher profit margin and it is often purchased together with product B. The company could bundle these two products to increase the sales of the products in order to increase its profit margin. <br> | ||
| − | + | === Key Concepts under Market Basket Analysis === | |
| − | === | + | There are a few key measurements under market basket analysis, which are:<br> |
| − | + | - '''Support''': ''Measure how frequent the item or item set appears in the transactions''<br> | |
| − | + | - '''Confidence''': ''Measure the likelihood that customers would buy the products shown in the rules, given that they have the products listed on the left hand side in their basket''<br> | |
| − | + | - '''Lift''': ''Co-occurence of products on the left hand side and right hand side exceeds the likelihood of products on left hand side and right hand side are independent''<br> | |
| − | + | <br> | |
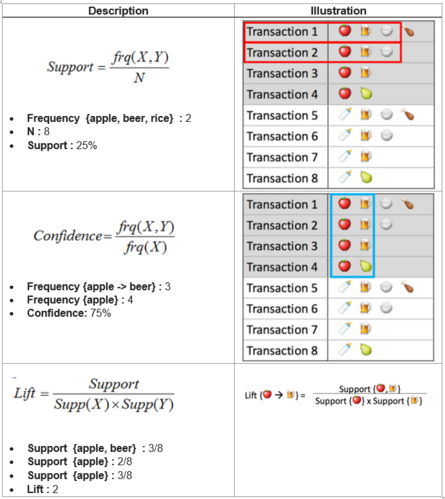
| − | + | Following are the illustrations of the key concepts mentioned above: <br> | |
| − | |||
[[File:Key indicator.jpg|x500px|thumb|none]]<br> | [[File:Key indicator.jpg|x500px|thumb|none]]<br> | ||
Revision as of 23:10, 21 April 2020
Contents
Abstract
Market Basket Analysis (MBA) is one of the key techniques used by large retailers to uncover associations between products brought by consumers. In our case, we apply a sequential version of MBA, called “sequential itemset mining” or “sequential pattern mining”, to analyze whether buying one item in the past indicates a higher likelihood of buying other things in the future. For instance, whether purchasing peanut butter implies sales of bread in the near future.
Market Basket Analysis
What is Market Basket Analysis?
Market basket analysis is a type of data mining technique to find association rules between different objects in a set, find frequent patterns in a transaction database, relational databases or any other information repository.
Application of Market Basket Analysis
This is often used in retail services to understand the products that are being purchased together. This would help the companies in designing their cross-sell or up-selling strategies. For example, assume product A has a relatively higher profit margin and it is often purchased together with product B. The company could bundle these two products to increase the sales of the products in order to increase its profit margin.
Key Concepts under Market Basket Analysis
There are a few key measurements under market basket analysis, which are:
- Support: Measure how frequent the item or item set appears in the transactions
- Confidence: Measure the likelihood that customers would buy the products shown in the rules, given that they have the products listed on the left hand side in their basket
- Lift: Co-occurence of products on the left hand side and right hand side exceeds the likelihood of products on left hand side and right hand side are independent
Following are the illustrations of the key concepts mentioned above:
Network Visualization Technique
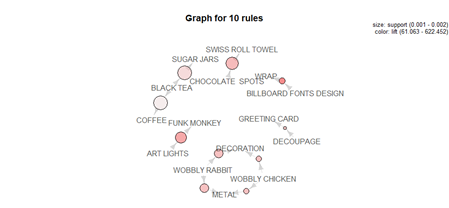
Network Visualization is a technique often used to show the relationships between the different items. As the name suggested, this technique shows the relationship in network type of format, which is easier for the users to understand how different items are related to one another.
This visualization technique would complement the association rules mined from market basket analysis.
Case Study: Instacart Grocery Data
To illustrate how the network visualization technique can complement the association rules derived from market basket analysis, we will be using dataset from Instacart.
This data is downloaded from the The Instacart Online Grocery Shopping Dataset 2017 on Feb 2020. The data dictionary can be found this link.
About Data Set
Below is the summary of the dataset used:
- There are more than 33,000,000 transactions from about 206,000 unique customers
- The transactions contains the products purchased by the customers under each order
- The sequences of the transactions are also available in the dataset
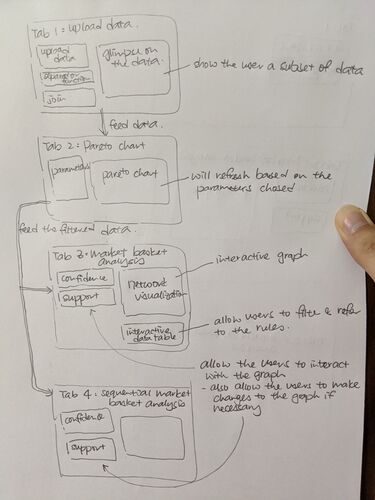
Application UI
Data loaded and preprocessing
Gentric market basket analysis by selecting threshold
Rule network on categories or items of interest
Time series analysis of selected category or item (line chart or bar chart)
Show the most ranking rules over time & Display rule between two items or categories over time
Objects
- Display the overview of relationship between category using Network diagram
- Show product bundles that expect to be consumed simultaneously and key indicators of each
- Interactively visualize how these bundles evolve over time
Packages Use
| Package | Description |
|---|---|
| arules | Provides the infrastructure for representing, manipulating and analyzing transaction data and patterns (frequent itemsets and association rules). |
| arulesViz | Extends package 'arules' with various visualization techniques for association rules and item-sets. The package also includes several interactive visualizations for rule exploration. |
| tidyverse | The tidyverse is an opinionated collection of R packages designed for data science. |
| readr | Read Excel Files in R. |
| dplyr | Tools for Splitting, Applying and Combining Data. |
| ggplot2 | Create graphics and charts. |
| Visnetwork | Create graphics and charts. |
Storyboard
In this project, we adopted the following principles:
- Design thinking through having periodic check-in with Prof Kam to ensure we are heading the right directions
- Fail early through iterating the prototypes with Prof Kam to land the interface design of the ShinyApp
Prototype
After several rounds of discussions with Prof Kam and several iterations, below is the final prototype for the design apps:
Following are key highlights of designed ShinyApps as shown in the prototype:
Note that this final prototype has incorporated the feedbacks Prof Kam provided along the way.

