ISSS608 2016-17 T3 Group8 Arules Project Proposal
|
|
|
|
|
Abstract
Association rule mining is a rule-based machine learning method which is meant to detect frequent patterns, correlations, associations, or causal structures from data sets found in various kinds of databases such as relational databases, transactional databases, and other forms of data repositories. arules is a robust association rule mining package of R. The richness of its functions is comparable to, if not more superior than the expensive commercial-of-the-shelves analytical toolkit such as SAS Enterprise Miner and IBM-SPSS Modeler. However, the usage of arules package tends to be confined within academic research. This is because the effective used of arules package required intermediate R programming skill which is not commonly available in the business analyst community.
In view of this limitation, our project seeks to provide an user-interface to arules package by using R Shiny framework. The user-friendly interface design allows casual users to manage, explore, calibrate and visualise complex items mining and association rules mining models without having to type a single line of code. Besides providing user-friendly interface, our application also incorporates an interactive graph visualisation method to enhance the interpretability of the outputs of frequent itemsets mining and association rules mining algorithms.
This presentation consists of five main sections. Firstly, the motivation and objectives of the project will be discussed. This is followed by a detailed discussion on the principles and concepts of association rule mining and the R packages used to perform association rules mining, the arules family of packages. Thirdly, the application and visualization design with respect to the improvements made to the arules visualization packages will be discussed. Following which, we will demonstrate the flexible use of our application with two different use cases. The presentation will conclude with a sharing of valuable insights gained through working on the project and potential application areas of our application.
Background on Association Rules
What is association rule mining?
- An association rule is a pattern that when an event occurs, another event occurs with a certain probability.
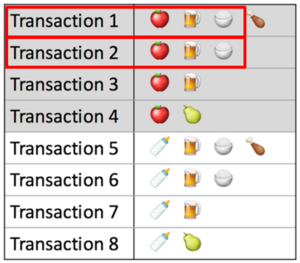
- Association rules are if/then statement that help undercover relationships between unrelated items. i.e. to find the relationships between the objects which are frequently bought together
- Association Rules find all sets of items (items set) that have support greater than the minimum support. Then using the large items to generate the desired rules that have confidence greater than the minimum confidence
- A typical and widely used example of association rules application is market basket analysis.It has an LHS and an RHS part and can be represented as itemset X => itemset Y. This means that the item/s on the right were frequently purchased along with items on the left.
Key indicators of Association Rules:
| Description | Illustration |
|---|---|
Support
|
|
Confidence
|
|
Lift
|
Generic VS Targeted Association Rule Mining
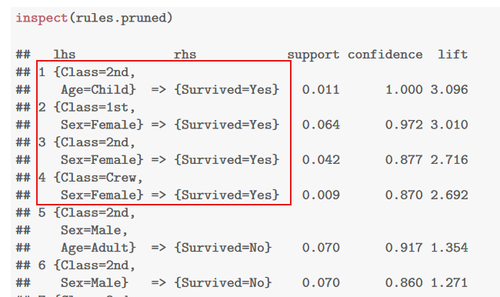
Although association rule mining is more commonly used for the market basket analysis, it can be used for other contexts as well. So instead of generically study the rules, we can also define a target of study, and use ARM to find out what combination of factors are more likely to lead to the occurrence of our target variable.In this case, the target of interest is always kept at RHS, as the consequent. A good example of the targeted ARM is demonstrated with the titanic data where people used association rule mining to see which group of passengers are likely to survive from titanic – the combination of passenger attributes shows that women and children are the ones survived.
Packages Used
There are two core packages used in our application, both of which are under the “arules” family.
arules:
“Arules” is the very foundation on which we built this application. “Arules” enables users to apply association rule mining algorithms on transaction data or any other data that meets certain requirement. It is quite powerful at manipulating and transforming data, pruning redundant rules, as well as filtering association rules generated. Users can filter the rules by customizing thresholds for support, confidence, and lift, as well as the antecedent and consequent, and sort the rules by support, lift and confident.
arulesviz:
“Arulesviz” is a R package that provides users various visualizations of association rules. Users can choose to visualize their association rules using scatter plot, matrix-based visualization, grouped matrix-based visualization, graph-based visualization, parallel coordinates plot, double-decker plot etc. The diversity of visualizations provided makes it the most popular R package for visualizing association rules. Yet one drawback of this package is that these visualizations are all static graphs, which lacks interactivity with users.
Our Goal
To build a generic application for association rule mining that:
1. Allows use of different datasets
We want to make it possible for any dataset to do association rule mining, not limited to transaction data anymore. We would like to break our application into two usages, one for generic market basket analysis, where users shall load transaction data and find the association rules within the items, the other for targeted association rule mining, where users can upload any kind of dataset with a target variable they are interested in so that they could find causation between this variable and other variables. This kind of exploratory analysis shall bring them insights and lay a solid foundation for them to do any further predictive analysis on the same dataset.
2. Improves functions of Current R packages
As is mentioned above, there are several limitations of current R packages for association rule mining. By building this R shiny app, we would try to exceed these limitations and bring the application and visualization of association rule mining to a new level. We would be specifically improving on:
1)Stats explorer
2)Network diagram
3)Interactivity of visualization
Our goal is that with this app, business users can find it interesting and useful to do association rule mining on their dataset, and they can get a clearer interpretation of the analysis results so that they would be able to gain more insights from it.


