Difference between revisions of "Project Groups"
Oisheeb.2019 (talk | contribs) |
|||
| Line 147: | Line 147: | ||
'''Cryptocurrency''' | '''Cryptocurrency''' | ||
| − | Abstract | + | Abstract As of March 2018, there are 1,658 cryptocurrencies in existence. The total cryptocurrency market capitalization is just under $369 billion. With the help of cryptography and a collective booking system called blockchain, cryptocurrencies build a distributed, safe and decentralized payment system, which does not need banks, intermediates, an organization or a central technical infrastructure to work. |
| + | However, mainly due to lack of regulatory support, Cryptocurrencies are highly volatile, which makes it a risky investment. Therefore, in this project, a Shiny web application is created with the cryptocurrency analysis in mind. It integrates three types of analysis: Time Series Analysis, Correlation Analysis and Portfolio Selection Analysis within one application. This application is made to be informative and allows potential investors of cryptocurrency to interact with the data embedded within the application, view the visualization and generate results based on the selected filters before they make decision on cryptocurrency investment. | ||
| + | |||
|| | || | ||
* [[Group07_proposal|Proposal]] | * [[Group07_proposal|Proposal]] | ||
Revision as of 17:33, 2 March 2020
|
|
|
|
|
|
|
Please change Your Team name to your project topic and change student name to your own name
| Project Team | Project Title/Description | Project Artifacts | Project Member |
|---|---|---|---|
| Project team name |
Project title Abstract (NOT more that 350 words) |
| |
| Group 2 |
A Visual Exploration of Media Consumption in Singapore Government communicators’ real-world experience of using survey data to better understand their audiences falls short of ambition. The analytics practices of market research firms goes some way to explaining why this gap persists. This project aims to provide government communicators with a user-friendly web-enabled application to visually discover the media consumption patterns and behaviours of major audiences in Singapore. Untapped insights from survey data can be revealed by encouraging deeper interaction through this interface. |
| |
| Group 3 |
Keys to the Past, Gateway to the Future As persons in academia or students currently being educated - we are so intimately connected to the library - as it is the place we consume knowledge and share ideas with each other. Therefore, wouldn't we hope the library be as good as it can be - giving us creature comfortable while having information accessible at our fingertips? Libraries are quipped to be the keys to the past and gateway to our future, but in a twist, data from Singapore Management University's 2018 Library Survey will be our keys to unlock insights so that we can pave the way for a better library for us to enjoy in the future. |
| |
| Group 4 |
Project title Abstract (NOT more that 350 words) |
| |
| Project team name |
Project title Abstract (NOT more that 350 words) |
| |
| Group 6 |
ATMs by Spar Nord in Denmark With banks transforming digital, there is less demand for cash. As reported by Mckinsey, in Denmark where electronic instruments have driven cash usage below 40 percent, banks are facing a constant challenge to reduce the fixed cost of ATM networks and the high manual cost of cash in operations, distribution, maintenance, and processing. In this project, we will use data visualization techniques to map out the ATMs location, volume of transactions, frequency of transactions. We will apply several data analysis techniques to analyze the utility of the ATMs. |
| |
| Group 7 |
Cryptocurrency Abstract As of March 2018, there are 1,658 cryptocurrencies in existence. The total cryptocurrency market capitalization is just under $369 billion. With the help of cryptography and a collective booking system called blockchain, cryptocurrencies build a distributed, safe and decentralized payment system, which does not need banks, intermediates, an organization or a central technical infrastructure to work. However, mainly due to lack of regulatory support, Cryptocurrencies are highly volatile, which makes it a risky investment. Therefore, in this project, a Shiny web application is created with the cryptocurrency analysis in mind. It integrates three types of analysis: Time Series Analysis, Correlation Analysis and Portfolio Selection Analysis within one application. This application is made to be informative and allows potential investors of cryptocurrency to interact with the data embedded within the application, view the visualization and generate results based on the selected filters before they make decision on cryptocurrency investment. |
| |
| Group 8 |
Re-imagining Bus Transport Network in Singapore Singapore's public transport use rose to hit a record high in 2018, with a total of 7.54 million trips made on buses or trains each day. Here's what may come across your mind: Do you ever have experiences where a bus ride that is supposed to be short and quick took way longer than expected? Are you frustrated that the bus stops at every stop even though there’s nobody boarding or alighting? And why do we have so many bus stops that almost nobody uses? What if we can reimagine the public bus network in Singapore through data? In this project, we will use data visualization techniques to map out all transportation nodes in Singapore and re-propose a different way of organizing our bus services, which include bus stops, bus routes, and connectivity within region and from regions to regions. |
| |
| Group 9 |
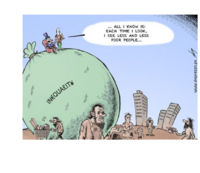
Poor In Wealth , Poor In Health ? Income equility is a hot issue these years,many sub-topics have been derived from this theme.Scholars have studied about the rootcause that result in this situation,the post-impact of income inequility and so on.Our project is to explore the relationship between individual income inequility and health.It will be a extension study of a existing work,published by Bakkeli, N., Income inequality and health in China: A panel data analysis. CHNS(China Health and Nutrition Survey) offer good resource for us to explore the income inequility problem in China,with more than 10 years data.Beyond original work scope,we will involve updated survey data to show the result.Besides,China context-income inequility gap among regions,will also be taken into consideration when conducting the analysis.The final result will be presented in a interactive visualization view. |
| |
| Group 10 |
Project title Abstract (NOT more that 350 words) |
| |
| Group 11 - LRT |
Google Analytics - Power Up! Google Analytics is a suite of analytical tools to provide insights on website access to aid businesses decisions. Our project aims to deliver a R-Shiny app that provides better interactivity in user interface, enhanced visualization and statistical analysis of key audience, behaviour and performance insights and a repeatable workflow for the export and import of Google Analytics data. |
| |
| Group 12 |
Global Warming, Global Warning! Global warming is an ongoing problem, and for a long time scientists have sounded the alarm about taking action to slow it down. Meanwhile, the situation continues to deteriorate. Rising temperatures have led to rising sea levels, changing rainfall patterns and more frequent extreme weather. Recent severe fires in Australia and locust plagues in Africa have been linked to droughts caused by warming temperatures. It is well known that the main cause of global warming is the massive use of fossil fuels (such as coal, oil, etc.) for nearly a century, which emits a large amount of CO2 and other greenhouse gases. These greenhouse gases absorb infrared light from the radiation emitted by the earth, causing the earth's temperature to rise. This project aims to let everyone know the trend of global warming and the emission of carbon dioxide in various countries, so that everyone can attach importance to this problem. |
| |
| Group 13 |
Visualization of Human Development Data In every corner of the world, people wish to live a life with greater prosperity. Well, if a dream can come true, it won't be called a "dream" anymore. For many people in many countries, a dream will always be a dream. From time to time, we hear melancholy stories telling the life of people who live on the sideline of society. |
| |
| Group 14 |
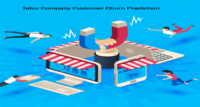
Customer Attrition Prediction and Visualization
|
| |
| Project team name |
Project title Abstract (NOT more that 350 words) |
| |
| Project team name |
Project title Abstract (NOT more that 350 words) |
| |
| Group 17 : Detectives |
Armed Conflicts in South Asia With the persistent existence of armed conflicts, it is important to understand the behavior of these events and how various factors impact the intensities of these events. This project aims at delivering an R shiny app that first provides a basic understanding of the nature of the armed conflict events, e.g. the different types of armed conflicts, the intensities in different countries in south Asia, and time series analysis to visualize the evolution of the armed conflicts with the impact in terms of fatalities over the period of 2016-2020 in South Asia. |
|


