JeromeQuah Ex2 Suitability
| OVERVIEW | PROXIMITY | CRITERION SCORES | AHP | SUITABILITY |
|---|
| With the AHP Scores for each of the factors for the construction of the CDQC buildings in Gombak, we can now combine the normalized proximity criterion score layers of the Roads, Buildings, Natural Features and Slope layer to determine the areas within the Gombak boundary that could be suitable for the CDQC. For the combination of the Suitability Raster Map, the following formula was used in the Raster Calculator: ("Buildings_Proximity_Normalised_Inverted@1"*47.9%) + The result would be the combination of all four of these normalized layer into a single criterion score Suitability Raster Map after the criteria weights were incorporated into their respective factors. The map below shows the output after symbolization. |
| RASTER MAP |
|---|
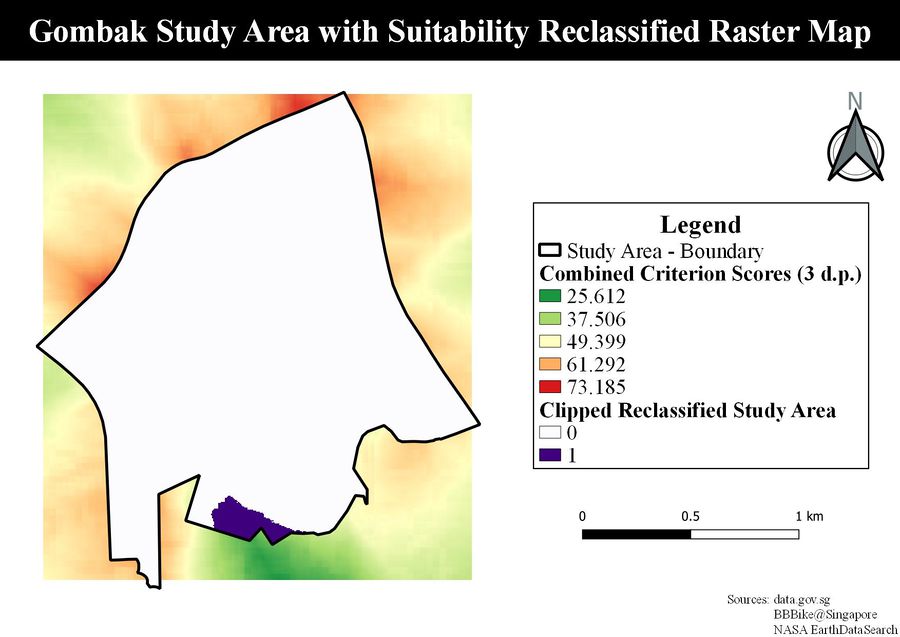
| Recalling from the Criterion Score Map Layout of the Four Factors, in which all their scales followed 0 to be FAVOURABLE and 1 to be UNFAVOURABLE, this map's scale would be interpreted in a similar fashion, in which the lower the values, the greater the favourability of that area being suitable for the construction of the CDQC. From this, the suitable areas would like in the yellowish-green color-coded areas in the Raster Map. However, in order to specifically digitize the possible areas for the CDQC, we would need to reclassify the pixel values using a certain range threshold. The Reclassify by Table function was used with this map as its input, using the following reclassification.
The output for the reclassification function was further clipped within the Gombak area boundary via the Clip Raster by Mask Layer function with the reclassification layer and the Gombak area layer as its inputs to return the map view below. |
| RECLASSIFIED RASTER MAP |
|---|
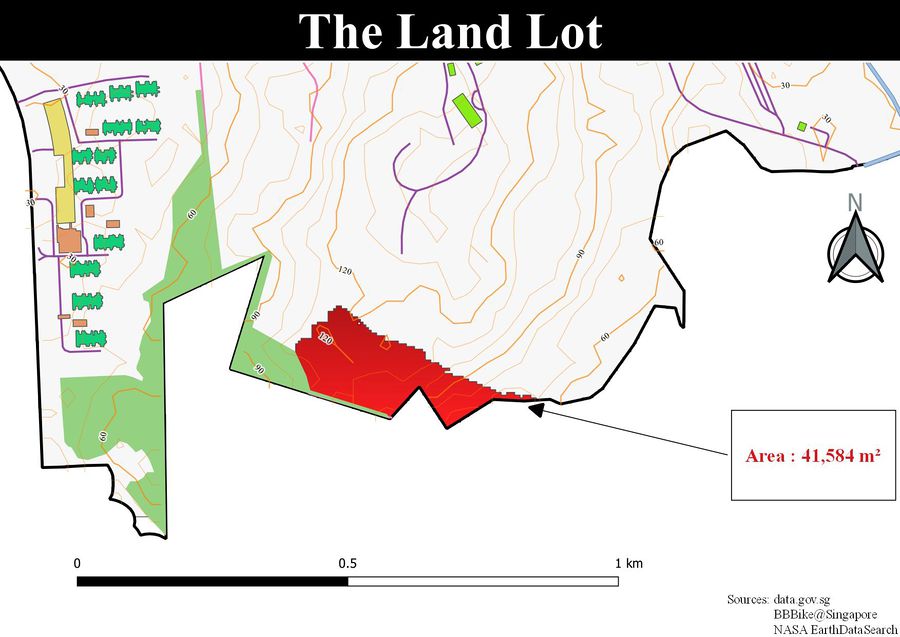
| This map view further shows the suitable area within the Gombak boundaries represented by the Value 1. In order to derive the area of this site, we need to convert this area into polygons. From this, the Polygonize (Raster to Vector) was used to convert this layer into a vector layer. From the returned output of the function, a new field named Area was created into the Attribute Table of the layer via the Field Calculator. The following syntax was used to derive the areas of the polygons in the layer.
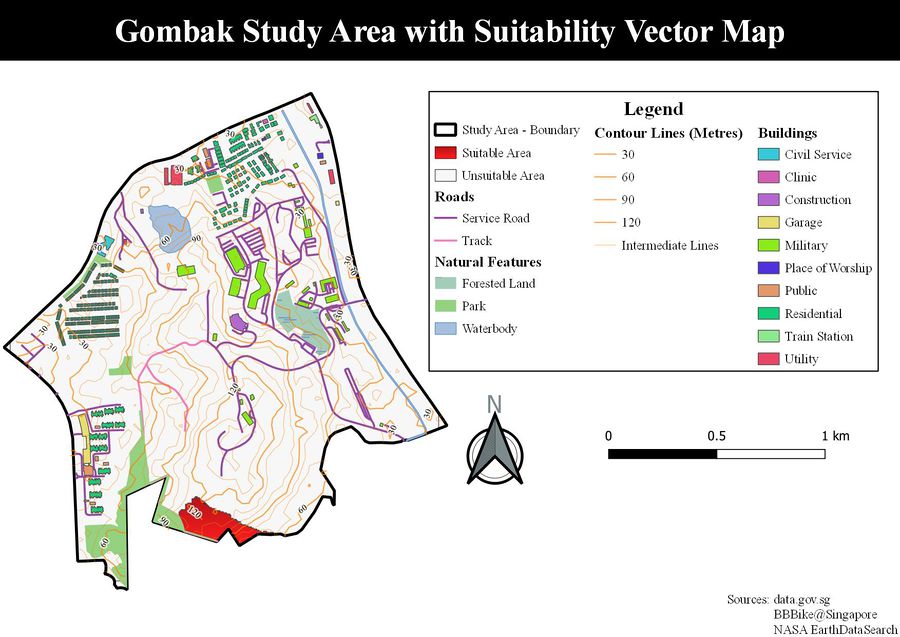
The following map view shows the suitable site derived from the Suitability Maps with the inclusion of Roads, Buildings, Natural Features and Digital Elevation of Gombak. |
| VECTOR MAP |
|---|
| ABOUT THE LAND LOT |
|---|


