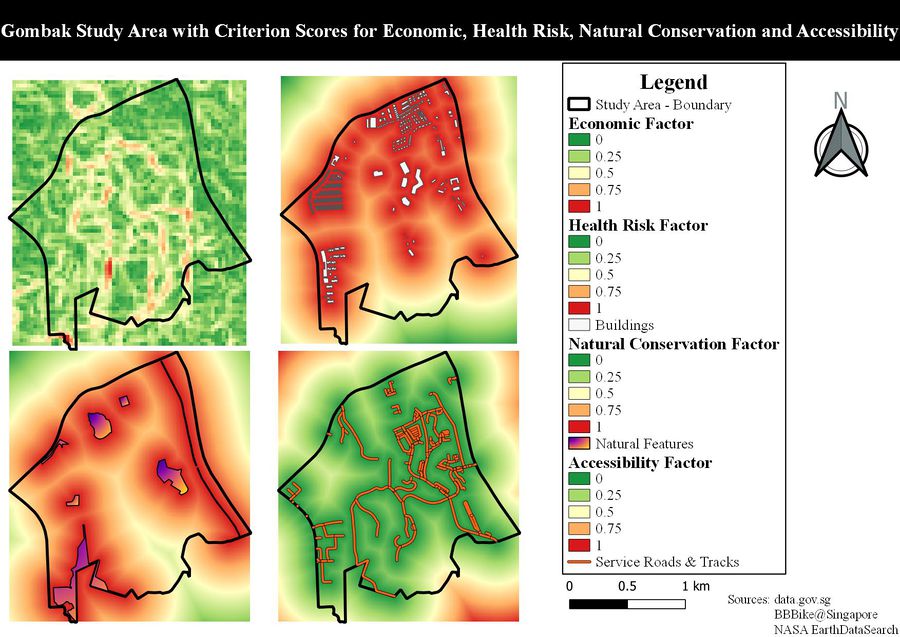
JeromeQuah Ex2 CriterionScores
| OVERVIEW | PROXIMITY | CRITERION SCORES | AHP | SUITABILITY |
|---|
| In order to come up with a standardized Criterion Score, we would have to ensure that the scale used across all four maps would have to be uniformed as well as the raster values of all four maps denoting the same value meaning at both ends of the scale. To further understand this better, the following was considered: 1. Necessity to Standardise a Scale to Use Across All Four Factors
2. Necessity to Invert Raster Pixel Value of Certain Map Views
From this, the following steps were carried out in the digitization of each of the views for this map: 1. Standardization: Normalization of all four Proximity Layers of the respective factors via the Minimum-Maximum Formula using the Raster Calculator
(Proximity Map of Feature − Minimum Value of Proximity Map of Feature) ÷ (Maximum Value of Proximity Map of Feature − Minimum Value of Proximity Map of Feature)
(1 − Normalized Proximity Map of Roads)
|
| ECONOMIC FACTOR (SLOPE) |
|---|
| From the Economic Factor View (Top Left), the suitable site for the building of the CDQC would preferably be located within the green areas of the Gombak Boundary in this view. The red areas indicate unfavorable locations for the CDQC, which in turn indicates a high slope terrain in these locations. |
| HEALTH RISK FACTOR (BUILDINGS) |
|---|
| From the Health Risk Factor View (Top Right), the suitable site for the building of the CDQC would preferably be located within the green areas of the Gombak Boundary in this view, which cover the bottom area of Gombak. The red areas indicate unfavorable locations for the CDQC, in which these areas are in close proximity to the buildings. |
| NATURAL CONSERVATION FACTOR (NATURAL FEATURES) |
|---|
| From the Natural Conservation Factor (Bottom Left), the suitable site for the building of the CDQC would preferably be located within the green areas of the Gombak Boundary in this view, which cover a small Southern-East area of Gombak. The red areas indicate unfavorable locations for the CDQC, in which these areas are in close proximity to the natural features alike the Health Risk Factor View. |
| ACCESSIBILITY FACTOR (ROADS) |
|---|
| From the Accessibility Factor (Bottom Right), the suitable site for the building of the CDQC would preferably be located within the green areas of the Gombak Boundary in this view, which cover a huge portion of the areas in Gombak. The red areas indicate unfavorable locations for the CDQC, in which these areas are far from the roads. |
| REFERENCES |
|---|
|

