IS428 AY2019-20T1 Assign Lim Zi Yuan 2
VAST 2019 MC2: Citizen Science to the Rescue
|
|
|
|
|
Contents
- 1 Compare uncertainty of the static sensors to the mobile sensors. What anomalies can you see? Are there sensors that are too uncertain to trust?
- 2 Which regions of the city have greater uncertainty of radiation measurement? Use visual analytics to explain your rationale.
- 3 What effects do you see in the sensor readings after the earthquake and other major events? What effect do these events have on uncertainty?
Compare uncertainty of the static sensors to the mobile sensors. What anomalies can you see? Are there sensors that are too uncertain to trust?
Uncertainty of Sensors and anomalies detected
Static Sensors
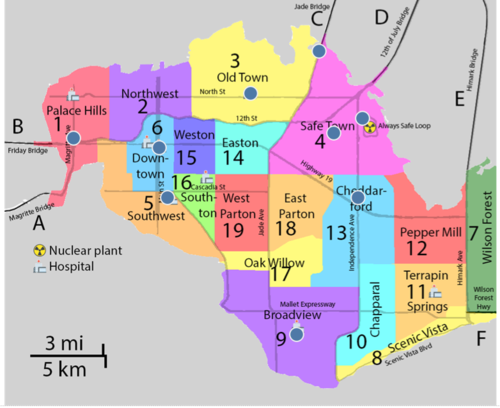
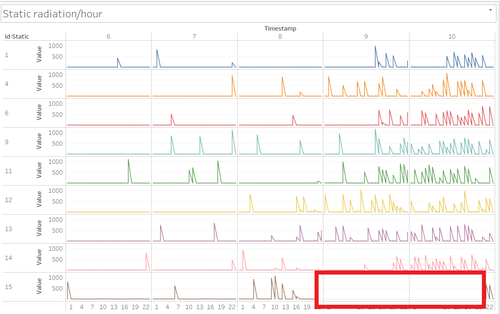
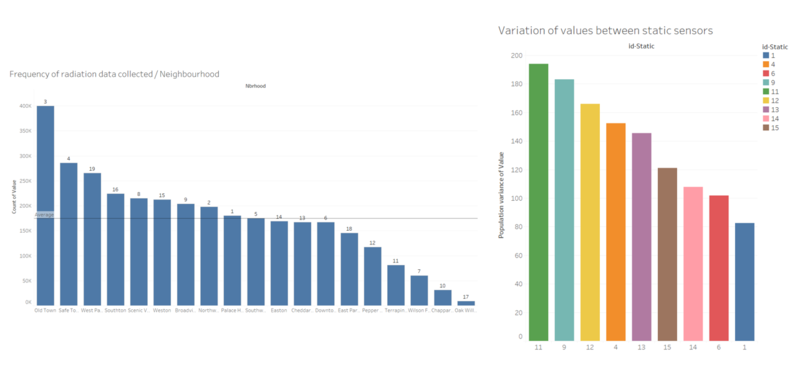
St Himark is made out of 19 neighbourhoods. However, there are only 9 static sensors present to detect radiation levels. The lack of sufficient static sensors means that we wouldn't be able to get an accurate reading of the overall state of radiation leakage in St Himark, thus reducing the overall certainty of the sensors.
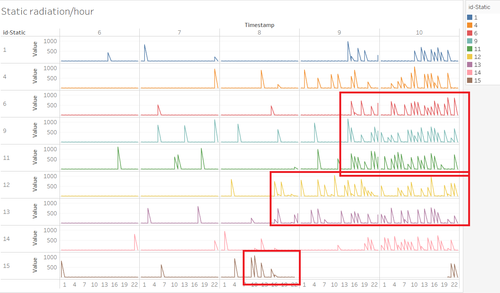
The static sensors are mostly in sync with one another. Sensors 12, 13 and 15 show consistent waves of radiation spikes earliest which would make sense as those sensors are located closest to the Nuclear plant. Sensor 15 however, was unable to detect any radiation data from 8th April 10pm to 10th April 8pm. I hypothesize that the Sensor was damaged during the Earthquake and subsequently repaired upon discovery. Without additional information, it would be difficult to determine the actual cause for Sensor 15's failure.
Mobile Sensors
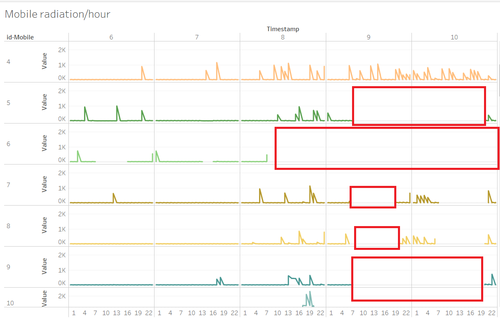
Mobile sensors are used by everyday citizens who attach the sensor to their car. As a result, missing data is expected as citizens are not driving constantly or they might be at out of range locations. From the graph attached, we can see that several mobile sensors have blocks of 0 readings. Using mobile sensor 5 and 6 as an example, they both have lapses of empty data at 9th April 7am and 8th April 7am respectively. If we were to follow the movement of these sensors at the timing of their disappearance, we would see that Sensor 5 left town via Jade Bridge and Sensor 6 stopped at Southon for the day, both plausible scenarios for the lack of radiation data.
By looking at the radiation data collected by our mobile sensors, we can see they generally cluster within the 0-2000cpm range. However, a value of 57345 cpm was detected by mobile sensor 12 on the 9th April at 2am. This value seems highly improbable. With reference to the movement of Mobile sensors at that time, sensor 12 was located closely to other sensors (8 and 7) yet their readings differ greatly with Sensor 7 having 0cpm and Sensor 8, 220cpm. Therefore, we can hypothesize that the recorded value was a one off anomaly and should be filtered out from subsequent visualizations.
Which regions of the city have greater uncertainty of radiation measurement? Use visual analytics to explain your rationale.
Radiation measures are categorized based on Static and Mobile sensors. Based on static sensors, we can split the sensor location by region
- Safe Town - Sensor 12, 13, 15
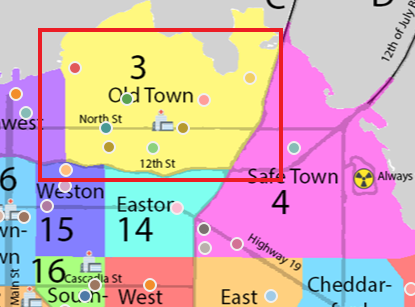
- old town - Sensor 9
- downtown - Sensor 4
- southwest - Sensor 6
- palace hills - Sensor 1
- cheddarford - Sensor 14
- broadview - Sensor 9
The region Safe Town, should have the highest values as its closest to the location of the nuclear plant. However, Sensor 15 recorded 0 data for an extended period of time.
When we look at variance of sensor values, Sensor 11,9 and 12 display the highest variance, as a result their radiation measurements are likely to be uncertain when looking at static sensor data alone.
Data derived from Wilson Forest is likely to be uncertain as well. The region is located relatively far away from the Nuclear site yet it boasts high radiation measurements despite low frequency of data collected about it.
What effects do you see in the sensor readings after the earthquake and other major events? What effect do these events have on uncertainty?
On the simple conjecture that Static sensors operate more consistently and are better engineered than quoted "lower cost homemade sensors", Mobile sensors. I will assume that the static sensors are more reliable than the Mobile sensors. Using static sensors as a gauge, we can estimate that the earthquake happened around 8th April 9am. Sensor 15 received waves of high radiation before subsequently decreasing and turning off completely. As it is situated right at the nuclear plant, Sensor 15 would definitely be the first to receive radiation readings from the plant. I hypothesize that as the earthquake happened, Sensor 15 began to slowly breakdown due to collateral damage before shutting off completely.nBased on this hypothesis, the earthquake resulted in static sensors generally rising in radiation level which was largely what we expected, increasing certainty for Static Sensors.
On the other hand, on 8th April around 9am, Mobile Sensors readings varied largely. Some sensors increased in radiation readings, decreased or remained constant. This is likely to be determined by the traveling path of each vehicle during this time period. This lowers our confidence in Mobile Sensor readings as they do not necessarily behave the way we expect them to.
