IS428 AY2019-20T1 Assign Lim Zi Yuan 3
VAST 2019 MC2: Citizen Science to the Rescue
|
|
|
|
|
Highlight potential locations of contamination, including the locations of contaminated cars. Should St. Himark officials be worried about contaminated cars moving around the city?
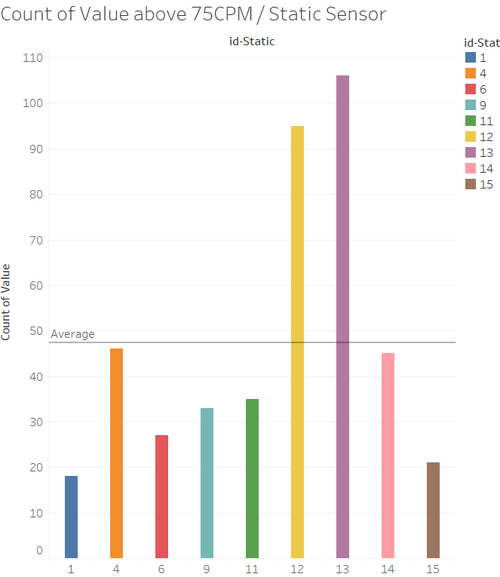
To qualify as a potential location of contamination, the location must have readings of above 75cpm. We start by filtering out all radiation data in the days before the Earthquake. Now we filter the remaining result to only show non background radiation values (i.e above 75cpm). We count the number of values above 75cpm to gauge which locations are More Likely to be contaminated. We use an average line to determine which locations are more likely to be contaminated than others. It is noteworthy to mention that this solution is derived using likelihood. All sensors in the graph could possibly be contaminated but by using this methodology we are able to determine which sensors are more likely to be so. From the chart, we can see that Sensor 12,13 and potentially 4 and 14 are more likely to be contaminated.
Locations contaminated - Safetown, Old Town, Downtown, Cheddarford.
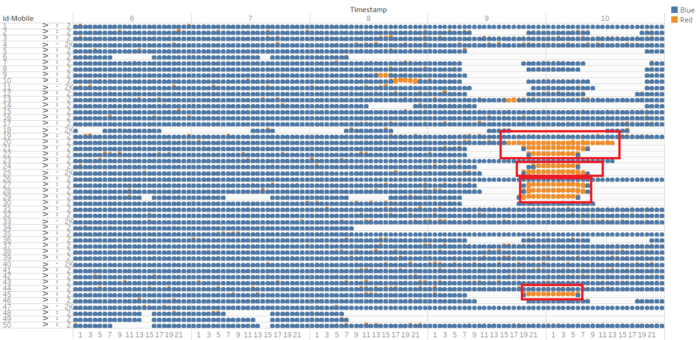
By cross referencing the moment mobile sensors gain a spike in their value with the area they were at, we are able to locate where the cars became contaminated. I use a calculated field to detect cars exposed to extended periods of high radiation (above 75), the orange circles denote a radiation reading of above 75cpm.
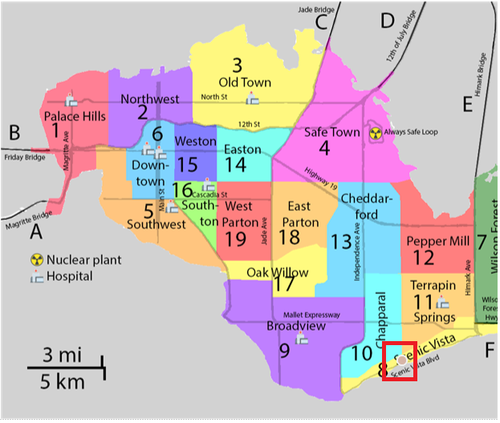
We are able to identify that sensors 20, 21, 22, 24, 25, 27, 28, 29 and 45 are contaminated at different timings between the 9th April to 10th April.
| Sensor Id | Time of Contamination | Location |
|---|---|---|
| Old Town | ||
|
Scenic Vista | ||
|
Wilson Forest | ||
|
Wilson Forest | ||
|
Scenic Vista | ||
|
Wilson Forest | ||
|
Wilson Forest | ||
|
Wilson Forest | ||
|
Wilson Forest | ||
|
Wilson Forest |
Based on Mobile Data, locations of possible contamination are Old Town, Scenic Vista and Wilson Forest.
St Himark officials should be concerned about contaminated cars moving around the city as the cars can spread radiation as they travel.
Estimate how many cars may have been contaminated when coolant leaked from the Always Safe plant. Use visual analysis of radiation measurements to determine if any have left the area.
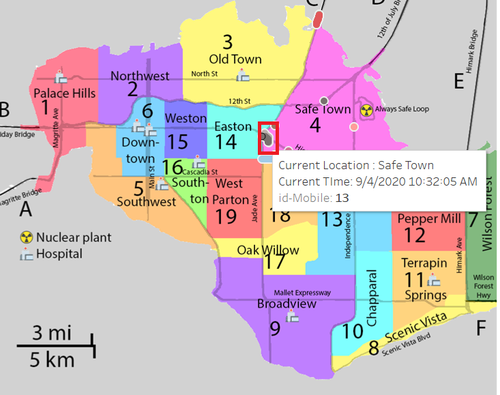
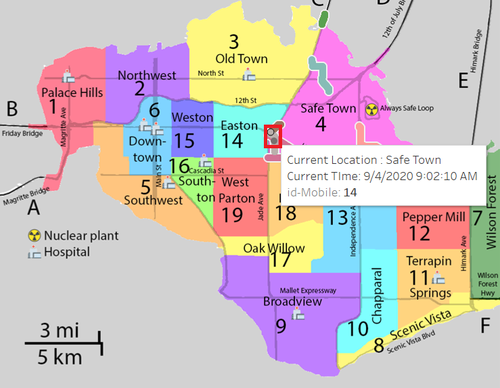
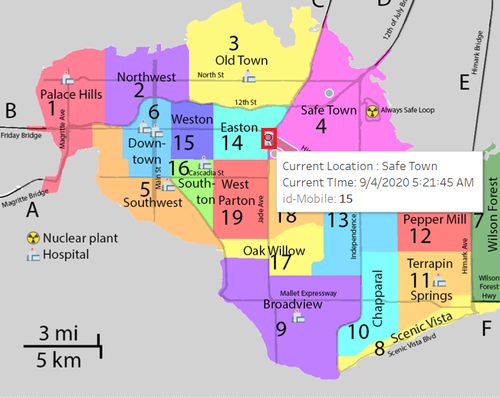
Following our previous hypothesis that the Earthquake occurred at 8th April 10am, we can discover which cars were at Safe Town by filtering values by neighbourhood. Assuming that when the coolant leaked, a large quantity of radioactive material burst out due to high pressure. This could potentially explain why we previously picked up an unusually high data value of 57345cpm nullifying our previous argument that it was a one off error reading. Using this as a basis, we track the sensors that were at Safe Town at the time of the coolant leak, 9th April 2am.
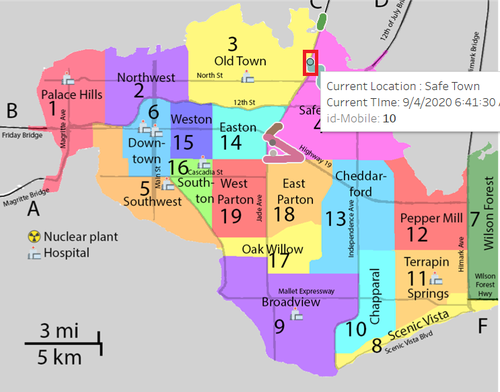
Based on the Chart, we can see that Sensors 10, 13,14 and 15 were present at Safe Town. Tracking their path through our Time Period filter, we see that
Sensor 10 exits Safe Town and heads to Old Town at 9th April 6.41am Sensor 13 exits Safe Town and heads to Easton at 9th April, 10.32am Sensor 14 exits Safe Town and heads to Easton at 9th April, 9.02am Sensor 15 exits Safe Town and heads to Easton at 9th April 5.21am
Therefore concluding at all 4 cars had left the area and contaminated other regions.
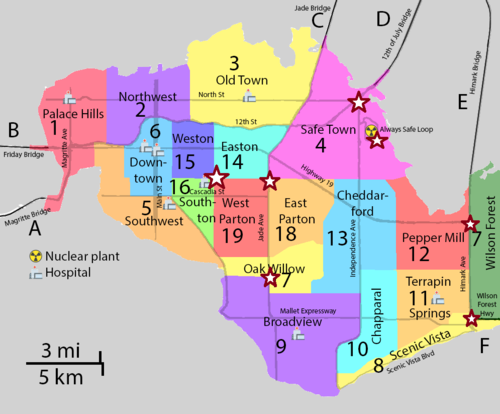
Indicated where you would deploy more sensors to improve radiation monitoring in the city. Would you recommend more static sensors or more mobile sensors or both? Use your visualization of radiation measurement uncertainty to justify your recommendation.
Static Sensors should be deployed at areas indicated with Star symbols.
A sensor should be deployed on the path towards 12th of July Bridge from Safe Town to get readings of radiation for cars entering and leaving the area An additional sensor should be deployed at the nuclear plant in the event the initial sensor breaks down, we will still be able to record radiation readings. Sensors should be deployed on the roads around Wilson Forest as at present there are no sensors to detect radiation levels around that area. Sensors should be deployed at the intersect of Weston, Easton, Southon and West Parton to capture inter town radiation readings. A sensor should be deployed at Oak Willow as there are no sensors around that area.
I would recommend more Mobile sensors as they are mentioned to be cheap and easily made. Having additional mobile sensors allow for a larger data pool which would allow for more accurate readings.
