IS428 AY2019-20T1 Assign Lim Zi Yuan Data Analysis Transformation
VAST 2019 MC2: Citizen Science to the Rescue
|
|
|
|
|
Data Provided
Before we conduct any analysis, we have to perform data pre-processing to ensure that the data provided is in an easy to use format. The data provided to us are 1) MobileSensorReadings.csv 2) StaticSensorReadings.csv 3) StaticSensorLocations.csv 4) StHimark.shp
For our data preparation, we will use a combination of Tableau Prep and Tableau to format our data the way we want it.
Data Preparation
Upon inspection of the data source, I am able to see that StaticSensorReadings.csv and StaticSensorLocations.csv share the column "Sensor-id". Using tableau prep I merge the two files together allowing us to extract the value of each sensor at any given location
1) Combining Static Locations and Static Readings
The column Units is not used in our analysis and therefore we can remove it from our tables
2) Removal of Units Column
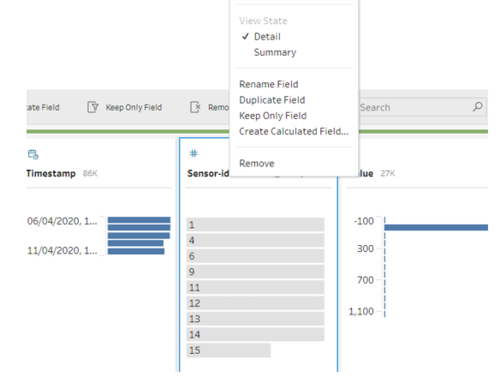
Both Mobile and Static data share the column sensor-id. To prevent misunderstanding, we assignment unique names to each column. id-Static and id-Mobile
3) Changing of Sensor-Id Name
In order to get a sensing of where our mobile sensors pick up radiation levels, we have to combine MobileSensorReadings.csv with StHimark.shp.
4) Combine Mobile Data with shape file


