IS428 AY2019-20T1 Assign Ngoh Yi Long Data
MC2: St. HiMark Radiation Monitor System
|
|
|
|
|
|
Data Provided
The data below are the ones used to create this dashboard.
| Dataset | Data Attributes |
|---|---|
| StaticSensorLocations.csv |
|
| StaticSensorReadings.csv |
|
| MobileSensorReadings.csv |
|
| StHimarkNeighbourhoodShapefile |
|
Data Preparation
| Steps | Description |
|---|---|
|
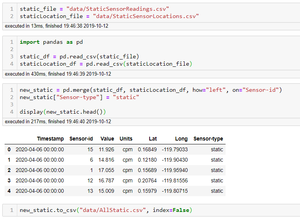
The static sensors location and its reading were split into 2 different csv files. To make sense of the data and better manipulation of it, I used Python Pandas library to merge both files together. As the static sensors and mobile sensors have similar sensor-id, I created a new column of data called “Sensor-type” to be able to differentiate the static and mobile sensors later. After manipulating the data into a merged data frame, I exported it into a new file called “AllStatic.csv” to be used. | |
|
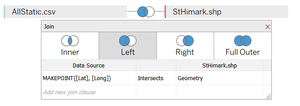
After that, I used the “AllStatic.csv” file and the given StHimark shape file to map the points of each row of data to the neighbourhood by using Tableau’s Makepoint function. I did a left join on the static sensors’ latitude and longitude coordinate and by using the Makepoint function to do an intersect on the Geometry of the shapefile. I extracted the data from these manipulated datasets into a new file called “AllStatic (Geometry).csv”. I also did the same for the mobile sensors file to create “AllMobile (Geometry).csv” so that both of the data now has the point of each sensor reading mapped to its respective neighbourhood. |


