IS428 AY2019-20T1 Assign Foo Yong Long RiskAnalysis
Contents
Question 1
Visualize radiation measurements over time from both static and mobile sensors to identify areas where radiation over background is detected. Characterize changes over time.
| Step | Description |
|---|---|
|
1 |
Mobile Sensors |
|
2 |
Static Sensors |
|
3 |
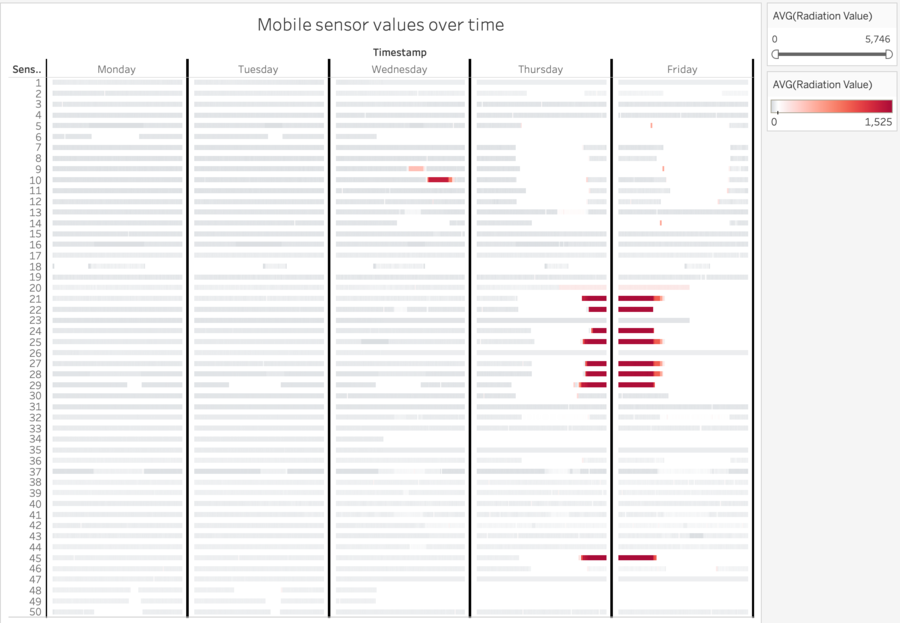
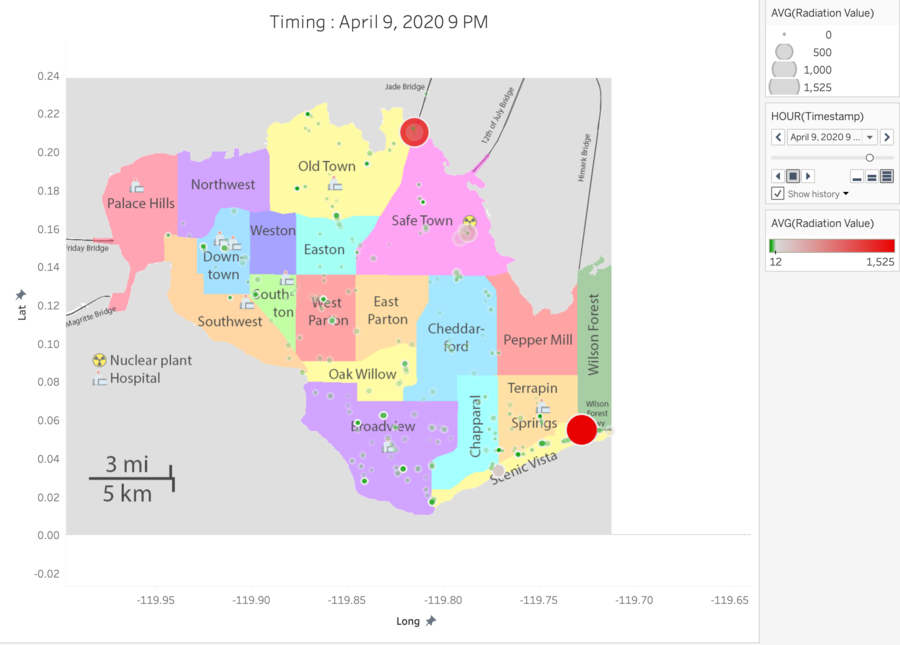
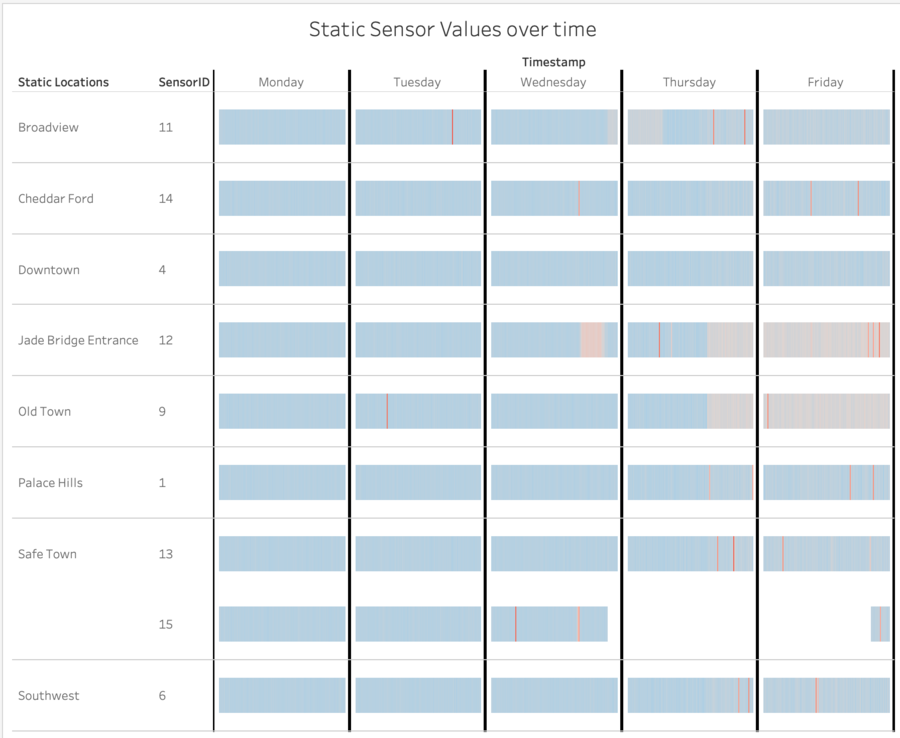
For the visualization of sensors over time, a Gantt chart view was created to analyze the values of radiation of both sensors. In general, places of concern include Old Town, Jade Bridge, and the southeast region which include Terrapin Springs, Wilson Forest and Scenic Vista. The time pills are set to continuous with "minutes" as the variable as the values are measured in counts per minute. The readings from mobile sensors support Static Sensors, which shows a spike in radiation on areas like Old Town, Jade Bridge, and the southeast region.
|
Question 3
Given the uncertainty you observed in question 2, are the radiation measurements reliable enough to locate areas of concern? Highlight potential locations of contamination, including the locations of contaminated cars. Should St. Himark officials be worried about contaminated cars moving around the city?
| Step | Description |
|---|---|
|
1 |
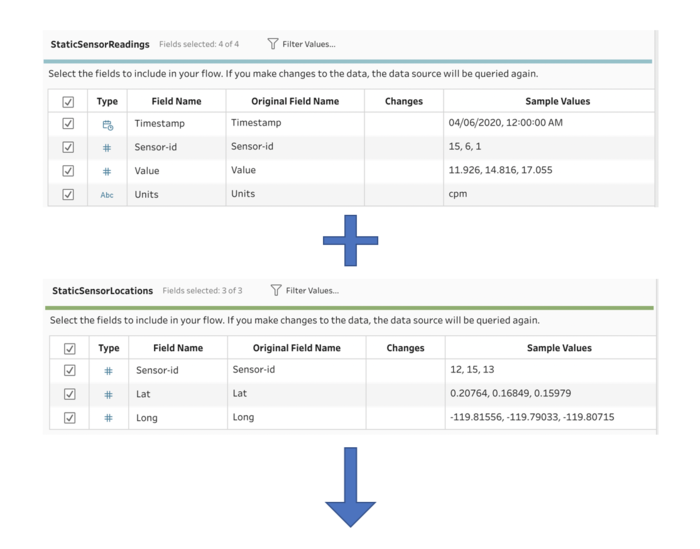
The static sensor data consist of two files. One of the files contains the longitudes and latitudes of the Sensors while the other file contains the timestamp of the sensors. Both files were combined utilizing an inner join by matching their Sensor IDs. |
|
2 |
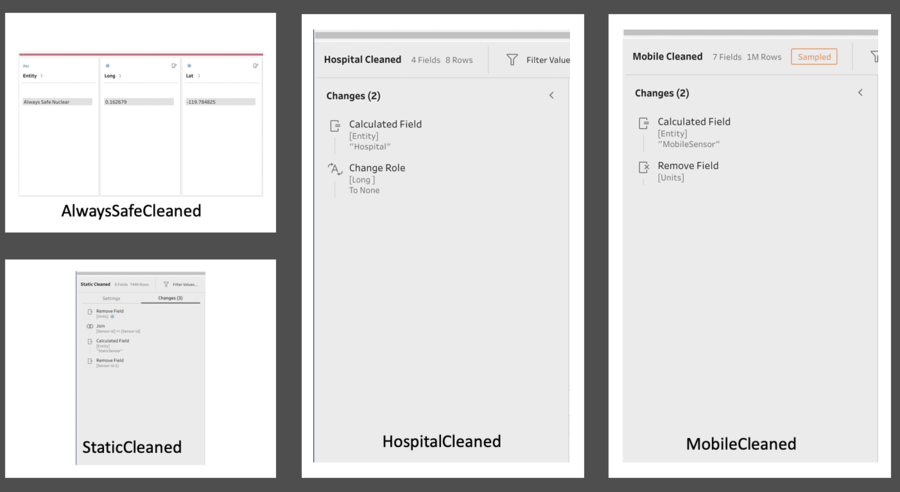
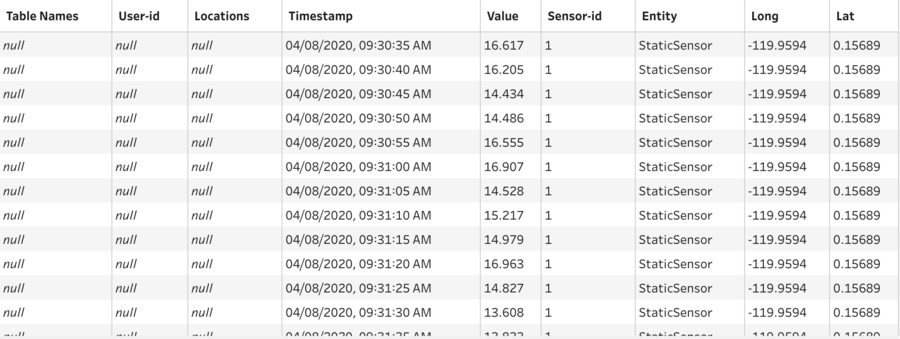
The column "Value" was removed from both the sensors file as it is redundant. A column "Entity" was created for all data to identify the respective data points." "MobileSensor" value in column "Entity" represents the data points belonging to mobile sensors. "StaticSensor" value in column "Entity" represents the data points belonging to static sensors. "Hospital" value in column "Entity" represents the data points belonging to hospitals. "Always Safe Nuclear" value in column "Entity" represents the data points belonging to Always Safe nuclear plant. These were used to differentiate the data points when combing the various data into one single data table which will be explained later.
|
|
3 |
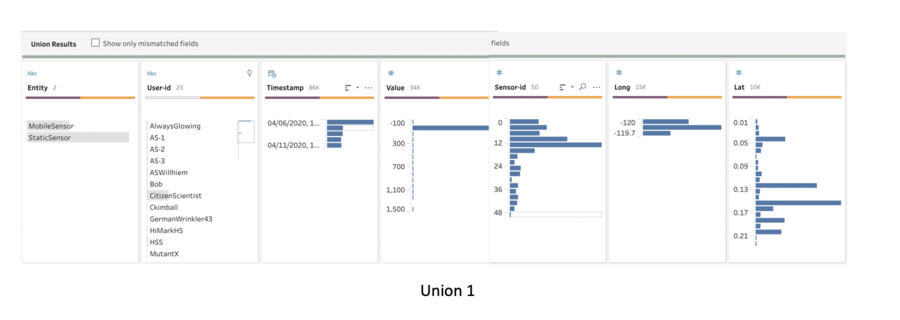
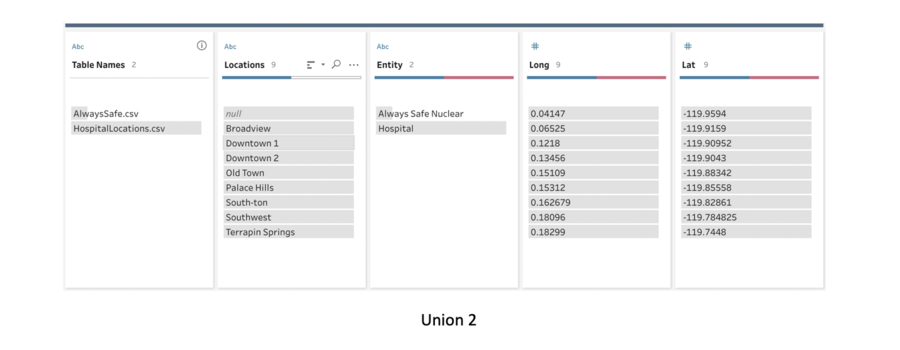
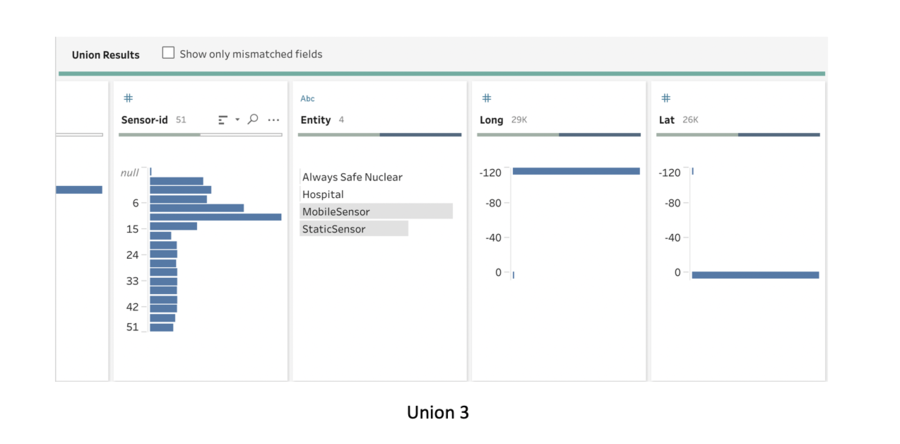
Next, we utilize the common field, "Entity", and the similarity in format and columns to create a union for the different datasets. |
|
4 |
The data is output as an extract and imported into Tableau. |
