IS428 AY2019-20T1 Assign Foo Yong Long Data Transformation
MC2 contains data of the Mobile and Static Sensors which display radiation levels in Counts Per Minute(CPM) that supports the entire length of the simulation(6th April 2020,0000Hrs - 10th April 2020,2359Hrs). The data cleaning process is as follow:
Data Preparation
To ensure a thorough analysis of the data, the values and locations of both Mobile and Static sensor categories have to be analyzed together. I have created two excel files labeled "HospitalLocations.csv" and "AlwaysSafe.csv" as shown below. This data will be utilized for distance calculation and to create a more interactive dashboard for the end-user.
Longitude and Latitude of Hospital Locations
Longitude and Latitude of Always Safe Plant
The data preparation was entirely done in Tableau Prep Builder. The final flow is as follow:
| Step | Description |
|---|---|
|
1 |
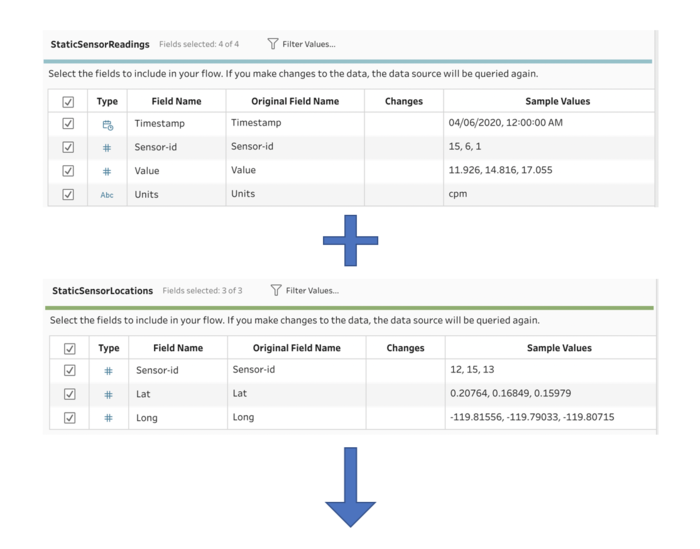
The static sensor data consist of two files. One of the files contains the longitudes and latitudes of the Sensors while the other file contains the timestamp of the sensors. Both files were combined utilizing an inner join by matching their Sensor IDs. |
|
2 |
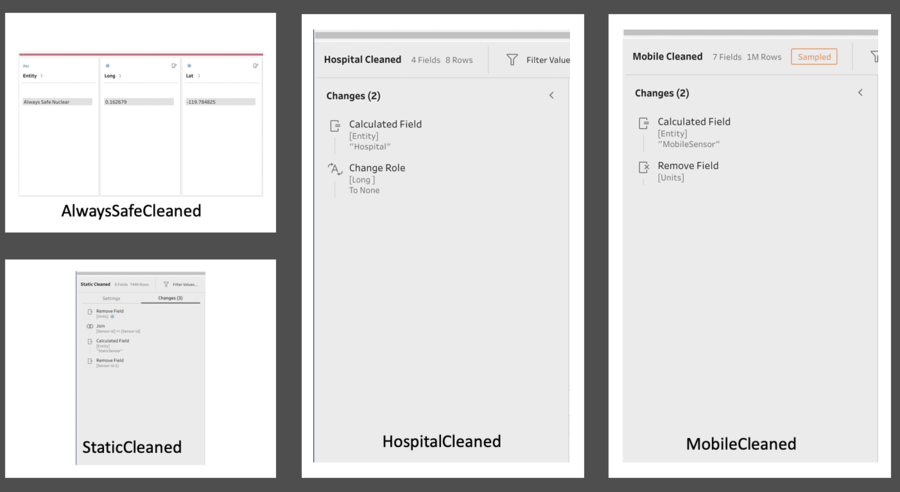
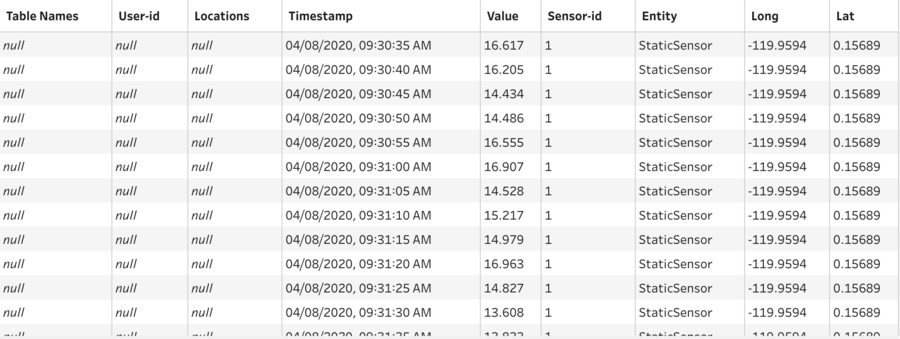
The column "Value" was removed from both the sensors file as it is redundant. A column "Entity" was created for all data to identify the respective data points." "MobileSensor" value in column "Entity" represents the data points belonging to mobile sensors. "StaticSensor" value in column "Entity" represents the data points belonging to static sensors. "Hospital" value in column "Entity" represents the data points belonging to hospitals. "Always Safe Nuclear" value in column "Entity" represents the data points belonging to Always Safe nuclear plant. These were used to differentiate the data points when combing the various data into one single data table which will be explained later.
|
|
3 |
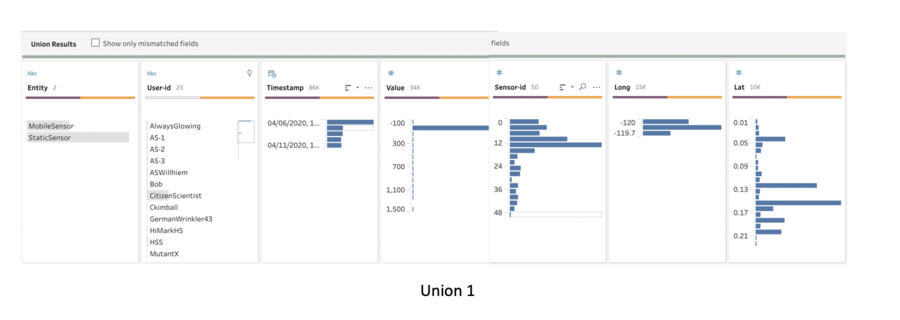
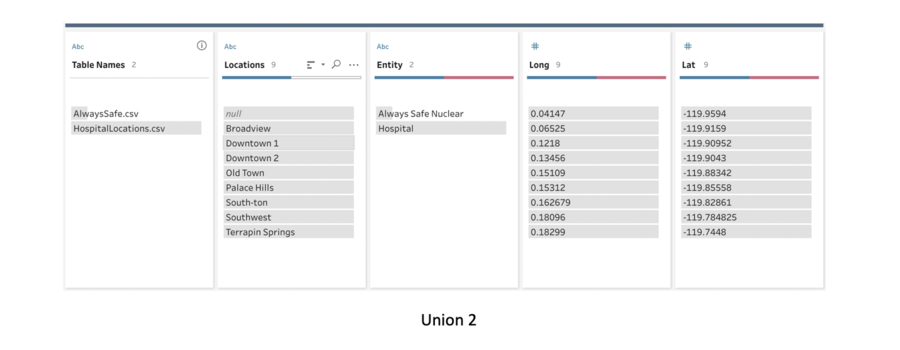
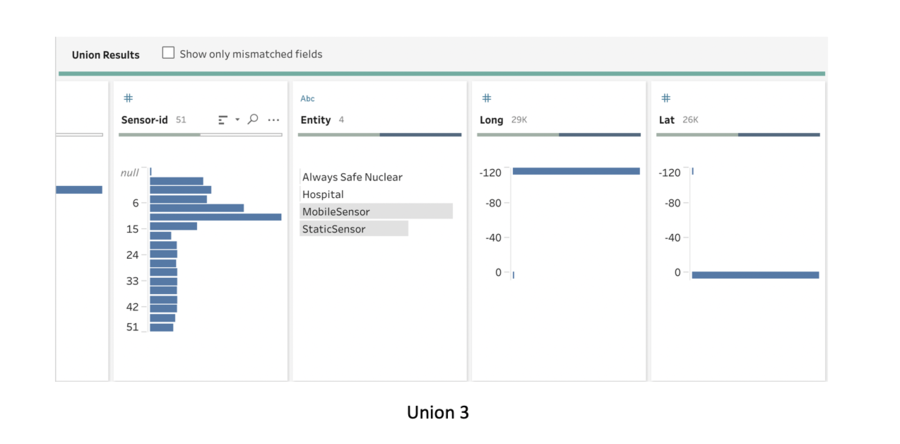
Next, we utilize the common field, "Entity", and the similarity in format and columns to create a union for the different datasets. |
|
4 |
The data is output as an extract and imported into Tableau. |
Additional Fields in Tableau
| Step | Description |
|---|---|
|
1 |
To ensure a more in-depth analysis and visualization, columns indicating distances in miles are being created to highlight the distance of each point from different entities such as hospitals and the nuclear plant. There are 3 new columns created in total : 1)"Distance from Nuclear Plant (Miles) " The column showing the distance of each data point from the nuclear plant 2)"1.Distance from PH HP (Miles)" The column showing the distance of each data point from the hospital in Palace Hills.
The column showing the distance of each data point from the nearest hospital. |
