IS428 AY2019-20T1 Assign Benedict Then Question 3
|
|
|
|
|
|
3.Given the uncertainty you observed in question 2, are the radiation measurements reliable enough to locate areas of concern?
Visualization Information:
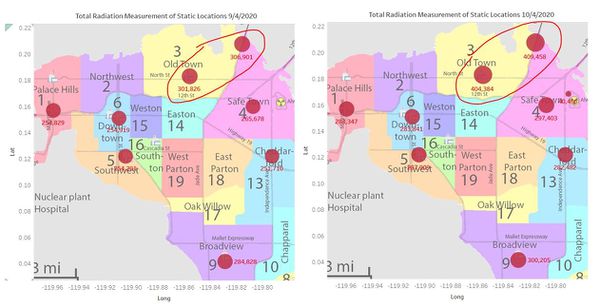
The visualization on the left shows the sumed radiation measurement of each Static Sensor on 9/4/2020 and 10/4/2020 when the major events occurred.
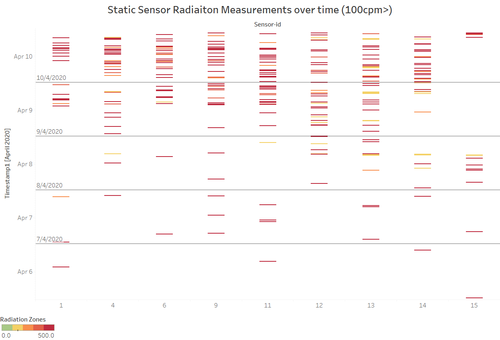
The visualisation on the right shows the radiation measurements of all Static Sensors individually from 06/04/2020 to 10/04/2020. Each dot represents one radiation reading of a sensor at a timestamp (e.g. 06/04/2020 12:00:05 PM, mobile sensor 1, 20 cpm).
Identifying potentially Contaminated Locations
Looking at the sum-ed radiation measurements on the map for 9/4/2020 and 10/4/2020, there is no obvious signs that any of the locations is contaminated. All the locations have similar sum-ed measurements. In addition, the visualization on the right shows that there are no obvious signs too. No Prolonged high radiation readings can be seen during the 4 days, at the very most, there are more frequent spikes during 9/4/2020 and 10/4/2020 but is not significant to identify clearly that the locations are indeed contaminated. At the very most, there are 2 locations that have a slightly higher reading than the rest, which are Old Town and Jade Bridge with 400k and above sum-ed radiation readings as compared to the rest with 280k - 300k in radiation measurements on 10/4/2020.
Visualization Information:
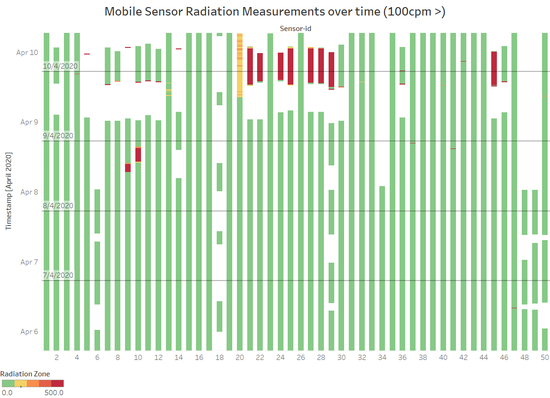
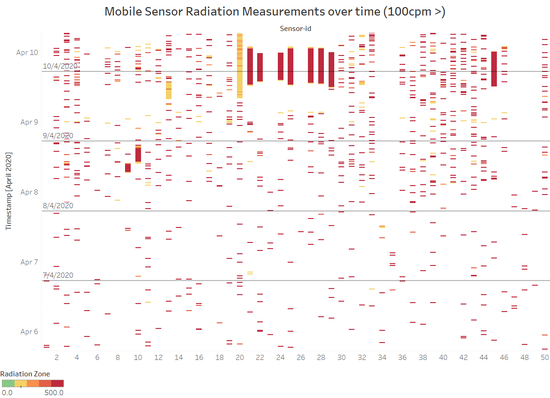
These visualisations show the radiation measurements of all Mobile Sensors individually from 06/04/2020 to 10/04/2020. Each dot represents one radiation reading of a sensor at a timestamp (e.g. 06/04/2020 12:00:05 PM, mobile sensor 1, 20 cpm). Both Visualisations above are the same. Just that the one of right has been filtered to show only radiation readings above 100cpm. The reason for the visualisation on the right is because there are so many radiation readings that are at a normal/green level that it made the high readings not visible. Hence, once I filtered it, we can see more high readings as shown in the second visualisation.
Identifying potentially Contaminated Vehicles
From the visualization above, we can that there are certain sensors that have a prolonged period of high radiation measurements of 100 cpm and above (Yellow Zone >). This can be seen in mobile sensors 9, 10, 13, 20, 21, 22, 24, 25, 27, 28, 29, 45. These prolonged high radiation measurements started from the latter half of 9/4/2020 to 10/4/2020, where it is around the same time as the earthquake resulting in radiation contamination. Hence, it is likely that these vehicles having these sensors are contaminated.
(As for the location of the contaminated cars, this question will be further answered in part b.)
Evaluation Criteria
To determine that the cars have been contaminated from the coolant leaked from the Always Safe plant, they have to be near that area and have a high radiation measurement at that point of time. If a mobile sensor has high readings but is not near the coolant leaked, it may be the region that is contaminated.
Earlier we have identified that mobile sensors 9, 10, 13, 20, 21, 22, 24, 25, 27, 28, 29, 45 are likely to be contaminated based on their high radiation measurements during the major events on 9/4/2020 and 10/4/2020. Now let's find out if their contamination is from the coolant leaked from the Always Safe Plant:
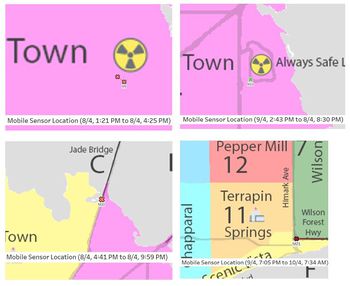
We can do this firstly by finding out the time period of each sensor where their reading is high. Next, we will then visualizes their location movement for that time period and visualize it if is near the nuclear plant. (Below shows the findings)
Conclusion:
Hence from the findings, from the findings, we can deduce that Mobile Sensor 9 and 13 which belongs to User-ID mySensor and HSS 's vehicles are contaminated from the coolant leaked; 2 vehicles. As for the rest of the mobile sensors, they were not near the nuclear plant. Hence, It is possible that the high prolonged radiation measurement might be due to regions contamination which are at Jade Bridge and Scenic Vista. (Answers part a)
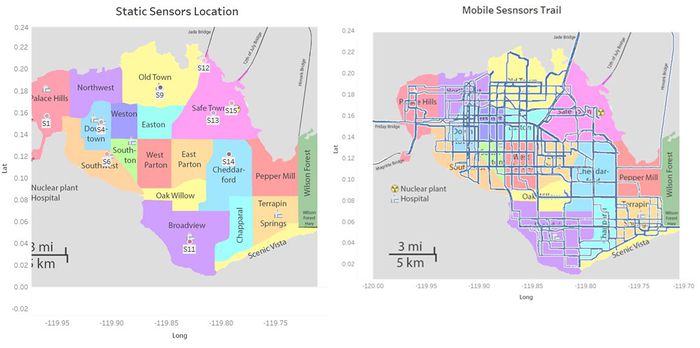
I would deploy Static Sensors around the Scenic Vista, Jade Bridge and Wilson Forest Hwy as these 3 locations currently do not have static sensors in placed. More importantly, they are probably contaminated due to the high radiation readings from multiple mobile sensors from cars who drove around that area. (analysis in part a & b) Furthermore, I would deploy a few more mobile sensors around these 3 areas to further validate and cross-check with the static sensors readings. In addition, in the event where the static or the mobile sensors happens to malfunction, data can still be retrieved from the other sensor that is working.
