IS428 AY2019-20T1 Assign Benedict Then Question 4
|
|
|
|
|
|
4.Summarize the state of radiation measurements at the end of the available period. Use your novel visualizations and analysis approaches to suggest a course of action for the city. Use visual analytics to compare the static sensor network to the mobile sensor network. What are the strengths and weaknesses of each approach? How do they support each other?
Summarize the state of radiation measurements at the end of the available period
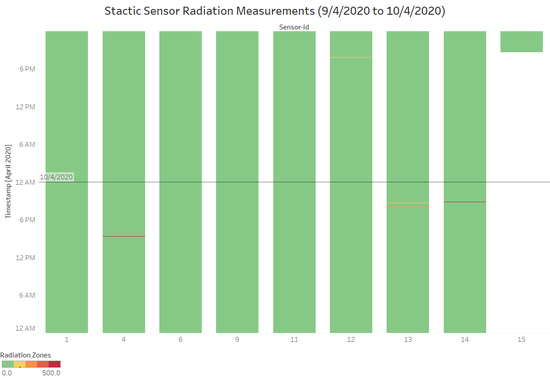
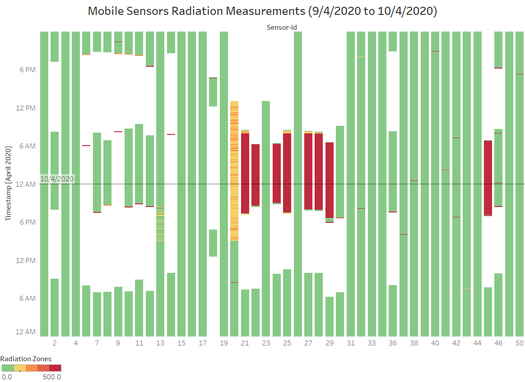
To answer this question, we will focus on radiation readings from 9/4/2020 to 10/4/2020 which is at the end of the available period. For Mobile Sensors, we can see that sensors with prolonged high radiation readings ended radiation readings earlier and there are no signs showing that their radiation reading decreased afterwards. As for Static Sensors, their radiation readings are low in general, no prolonged high radiation readings. In summary, radiation readings in Mobile Sensors comprise both high and low radiation readings while Static Sensor readings are low in general at the end of the available period.
Use your novel visualizations and analysis approaches to suggest a course of action for the city
- Identify contaminated cars and regions and look for a solution to decrease the radiation levels. From earlier analysis, Mobile sensors 9, 10, 13, 20, 21, 22, 24, 25, 27, 28, 29, 45 are potentially contaminated. St' Himark can firstly look at the trail of the vehicle locations of these sensors to identify when these vehicles got contaminated or when they did they encounter a contaminated region.
- Place Static Sensors on Scenic Vista and Wilson Forest Hwy as they may be potentially contaminated areas.
- In addition, Static Sensors can be placed in locations that currently do not have any.
- Do a maintenance check or replace static sensors 13 and 15. From the earlier analysis, Static Sensor 13 have low readings during the earthquake and radiation contamination and Static Sensor 15 did not have radiation readings during the major event.
Static Sensor
Strength
- There are stationed at a certain location and will be able to capture readings consistently throughout the available period.
- As they are static, their readings should be more stable than Mobile sensors.
Weakness
- They are only able to capture readings around the location where they are stationed. Unable to get readings at a further distance or at other locations.
- Only 1 sensor is placed in 1 region. If it is damaged, then readings will not be captured for that time period.
Mobile Sensor
Strength
- They are moving around, hence can cover more readings in more different areas.
Weakness
- Since they are at different locations at different time, the mobile sensors might not be present at the right place and time when the radiation contamination occurred.
- Mobile sensors are constantly moving, hence this might affect the sensor readings due to external factors.
How do they support each other?
- Both sensors can be compared to better evaluate and validate the uncertainty of the readings. If a static sensor has high radiation readings, then mobile sensors around that area are expected to have high readings as well. If this does not happen, then the uncertainty of the readings is high and it can be due to either a region or vehicle contamination.
- Static sensors cannot cover a wide area of readings. Hence, mobile sensors will be able to travel around and cover areas especially when static sensors are not located at.


