IS428 AY2019-20T1 Assign Benedict Then Question 1
|
|
|
|
|
|
1. Visualize radiation measurements over time from both static and mobile sensors to identify areas where radiation over background is detected.
Characterize changes over time.
Visualization Information
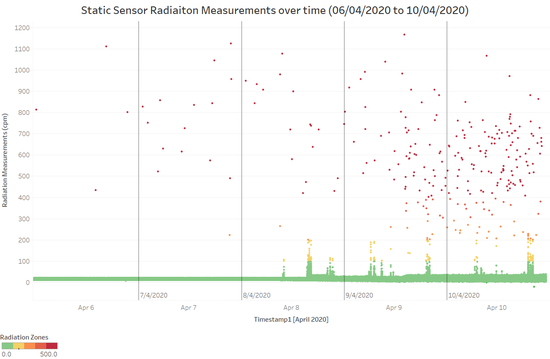
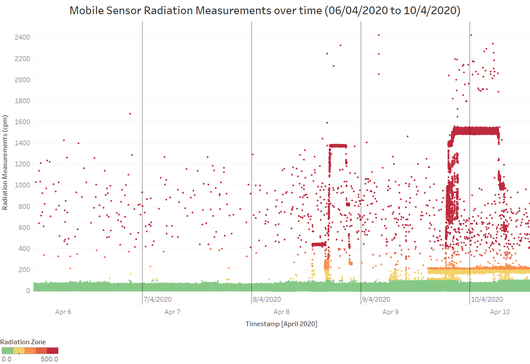
These visualisations show the radiation measurements of both Static and Mobile Sensors over time from 06/04/2020 to 10/04/2020. Each dot represents one radiation reading of a sensor at a timestamp (e.g. 06/04/2020 12:00:05 PM, static sensor 1, 20 cpm)
06/04/2020 and 07/04/2020 (Low radiation levels/Green Zone)
From the time period of 06/04/2020 to 07/04/2020, we can see that the majority of the radiation readings are low (green/healthy zone) in general. A few spikes in radiation measurements can be observed in both the Static and Mobile Sensors but nothing too out of the ordinary.
08/04/2020 to 10/04/2020 (High Radiation Levels/Orange/Red Zone)
From the time period of 08/04/2020 to 10/04/2020, we can see that radiation readings have increased drastically into the orange/red zones which are categorized as highly dangerous levels. In addition, some of them have prolonged high readings for a period of time. From the Mobile Sensor visualization, we can see very high prolonged measurements in 2 areas: (1) latter half of 08/04/2020. (2) latter half of 09/04/2020 spanning till the early half of 10/04/2020. From the Static Sensor visualization, we can see similar patterns of radiation readings as compared to the Mobile Sensor visualization. There is an increase in radiation readings (yellow/orange zones) from 08/04/2020 to 10/04/2020. In addition, more spikes (red zones) can be observed too. However, the readings from the Static Sensors are not as high or intensive as compared to Mobile Sensors which have very high and prolonged radiation readings.
Characterize Changes over time
From the radiation measurements over time, it is very likely that the earthquake and radiation contamination leak occurred around 08/04/2020 to 10/04/2020 as the radiation readings were very high and prolonged during that period of time.


