IS428 AY2019-20T1 Assign Lim Zi Yuan 3
VAST 2019 MC2: Citizen Science to the Rescue
|
|
|
|
|
Highlight potential locations of contamination, including the locations of contaminated cars. Should St. Himark officials be worried about contaminated cars moving around the city?
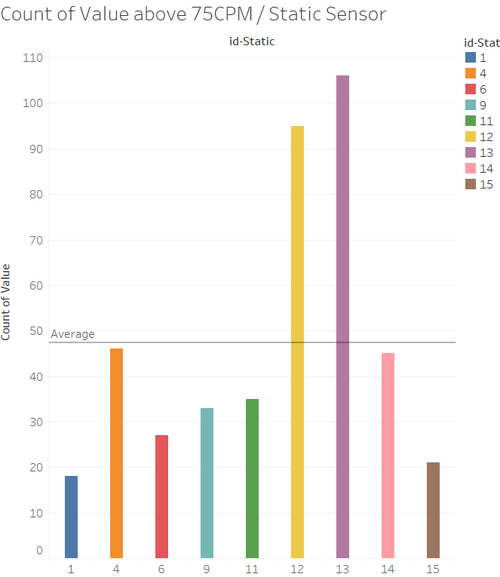
To qualify as a potential location of contamination, the location must have readings of above 75cpm. We start by filtering out all radiation data in the days before the Earthquake. Now we filter the remaining result to only show non background radiation values (i.e above 75cpm). We count the number of values above 75cpm to gauge which location is More Likely to be contaminated. We use an average line to determine which locations are more likely to be contaminated than others. It is noteworthy to mention that this solution is derived using likelihood. All sensors in the graph could possibly be contaminated but by using this methodology we are able to determine which sensors are more likely to be so. From the chart, we can see that Sensor 12,13 and potentially 4 and 14 are more likely to be contaminated.
Locations contaminated - Safetown, Old Town, Downtown, Cheddarford.
