IS428 AY2019-20T1 Assign Lim Zi Yuan 2
Revision as of 04:15, 11 October 2019 by Ziyuan.lim.2017 (talk | contribs)
VAST 2019 MC2: Citizen Science to the Rescue
|
|
|
|
|
Contents
Compare uncertainty of the static sensors to the mobile sensors. What anomalies can you see? Are there sensors that are too uncertain to trust?
Uncertainty of Sensors and anomalies detected
Static Sensors
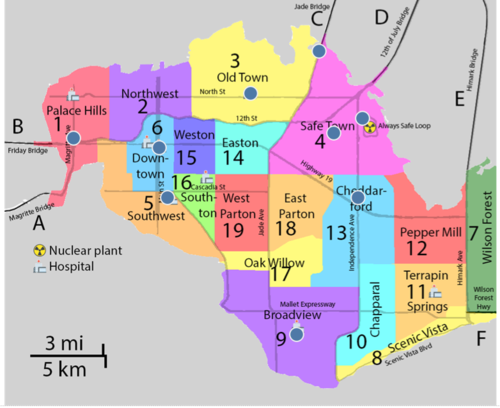
St Himark is made out of 19 neighbourhoods. However, there are only 9 static sensors present to detect radiation levels. The lack of sufficient static sensors means that we wouldn't be able to get an accurate reading of the overall state of radiation leakage in St Himark, thus reducing the overall certainty of the sensors.
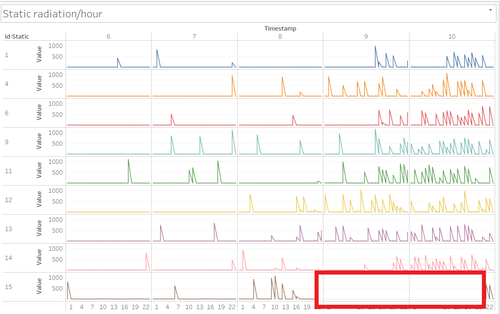
The static sensors are mostly in sync with one another. Sensors 12, 13 and 15 show consistent waves of radiation spikes earliest which would make sense as those sensors are located closest to the Nuclear plant. Sensor 15 however, was unable to detect any radiation data from 8th April 10pm to 10th April 8pm.

