IS428 AY2019-20T1 Assign Benedict Then Question 1
From Visual Analytics for Business Intelligence
Jump to navigation
Jump to search
 VAST 2019 MC2: Citizen Science to the Rescue
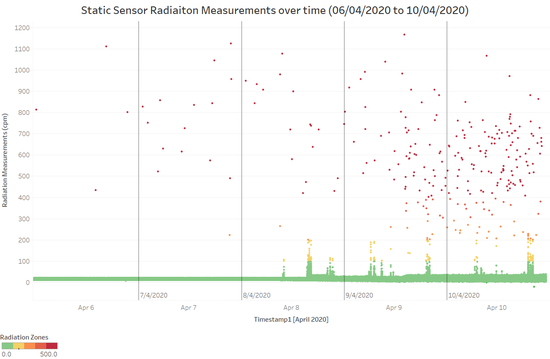
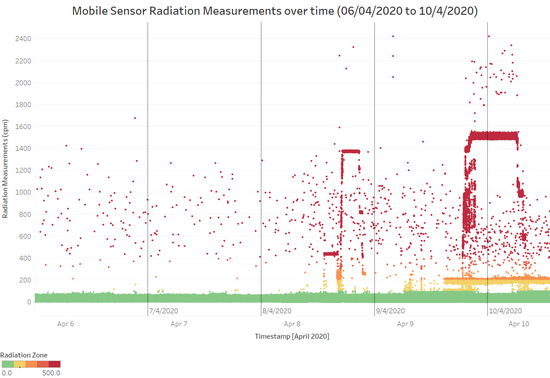
1. Visualize radiation measurements over time from both static and mobile sensors to identify areas where radiation over background is detected.
Characterize changes over time.

Static Sensor Radiation Levels over time

Mobile Sensor Radiation Levels over time