IS428 AY2019-20T1 Assign Wei Ming Questions
Question 1
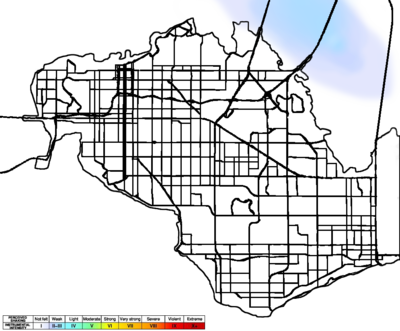
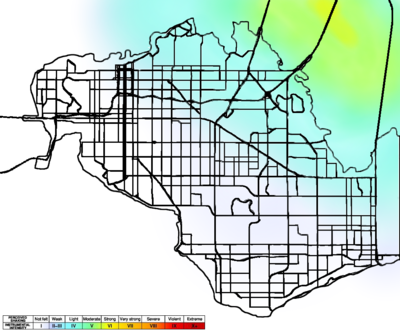
Question: Emergency responders will base their initial response on the earthquake shake map. Use visual analytics to determine how their response should change based on damage reports from citizens on the ground. How would you prioritize neighborhoods for response? Which parts of the city are hardest hit?
Answer:
Based on the two shake maps provided and the shake intensity visualization from the report data, it is easy to identify that the northeast part of the city is hardest hit, namely location 3, 7, 4, 12. The average severity of these areas are above 80% percentile.


