 VAST 2019 MC2: Citizen Science to the Rescue
Visualize radiation measurements over time from both static and mobile sensors to identify areas where radiation over background is detected. Characterize changes over time.
Limit your response to 6 images and 500 words.
| S/N |
Findings |
Visual Proof
|
| 1.1 |
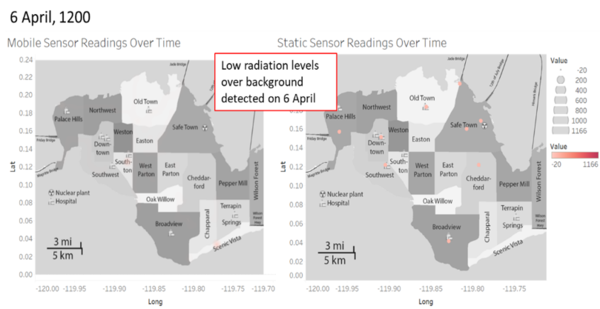
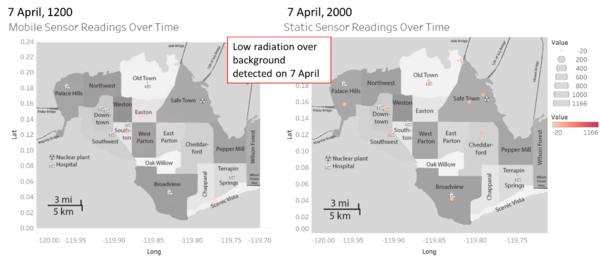
From the surface radiation concentration map based on readings from mobile sensors, we can see that there is little radiation above background for the first two days of the simulation, namely 6th April and 7th April 2020. This is supported by the static sensor readings as well, which record low radiation readings in each sensor on the two days.
|
|
| 1.2 |
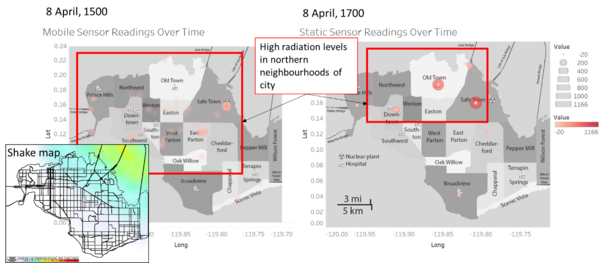
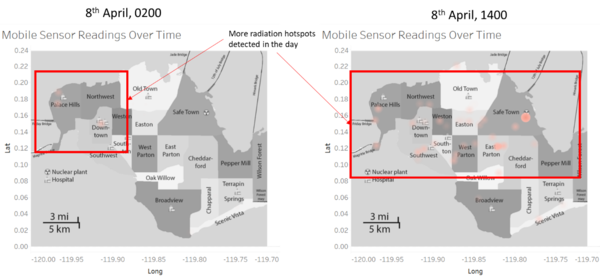
From 8th April, there are greater radiation levels detected among the northern areas of St. Himark.
This could be due to the earthquake which affected the northern neighbourhoods of St Himark, such as Old Town and Safe Town. This could have caused the Always Safe Nuclear Plant to experience a coolant leak, which is spreading through the city as shown.
The above explanation is also supported by the static sensor data, which shows the towns of Old Town and Safe Town experiencing high levels of radiation of up to 737cpm detected by static sensor 13, located near the nuclear plant.
The locations of high radiation are consistent with the shakemap of the earthquake. This shows that the northern region of St. Himark experienced the highest shake intensity. (Shake map obtained from MC1)
|
|
| 1.3 |
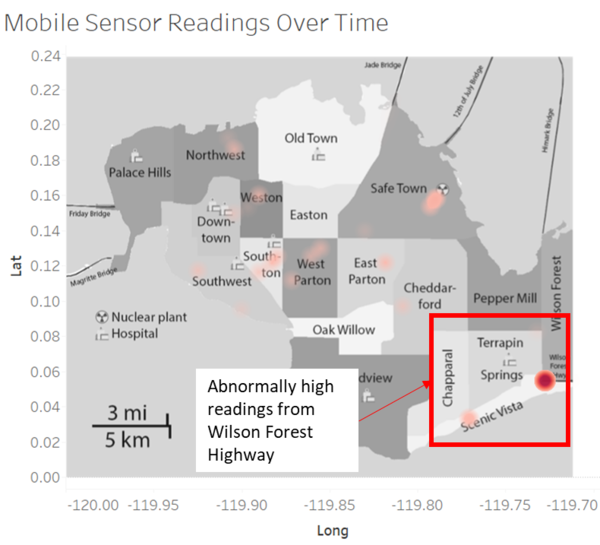
There are multiple high radiation readings detected at Wilson Forest Highway from 9th April, 1900 to 10th April, 0700. This could be due to contamination from other neighbouring cities that is accessed by the highway, since there was a sudden spike in readings. |
|
| 1.4 |
Generally, it was found that the radiation readings are lower past midnight till early morning as compared to in the day. This could be because the nuclear plant is not in operation at that time, or because there is less movement of cars and hence fewer radiation readings are taken which means that there would be a lack of data for this timeframe. |
|


