 VAST 2019 MC2: Citizen Science to the Rescue
Use visual analytics to represent and analyze uncertainty in the measurement of radiation across the city.
a. Compare uncertainty of the static sensors to the mobile sensors. What anomalies can you see? Are there sensors that are too uncertain to trust?
| S/N |
Findings |
Visual Proof
|
| A-1 |
Comparing the number of records taken per sensor:
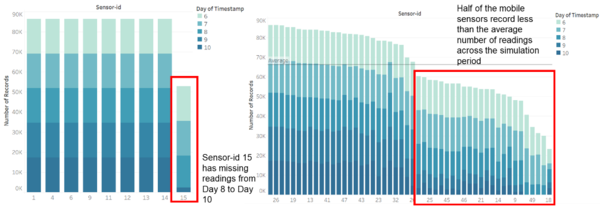
In general, the uncertainty of the mobile sensors is higher than the static sensors. Comparing the number of records captured by the sensors over the simulation period, the mobile sensors show a much larger variation in the number of records compared to static sensors.
The static sensors are mostly reliable, taking a consistent number of readings throughout the simulation period. This is except sensor-id 15 which did not record any readings for around 44 hours from 8th April 2300 to 10th April 1900. We can thus conclude that static sensor-id 15 is more uncertain as it stopped reporting readings during a crucial period where the average radiation levels in St. Himark increased.
Comparing between the mobile sensors, we can see that half the mobile sensors record lower than the average number of readings taken by the sensors over the simulation period. This could be due to reasons such as the sensor being turned off or being outside of the range of detection, especially if the mobile sensor leaves the city.
|
|
| A-2 |
Comparing the uncertainty of the readings taken by each sensor:
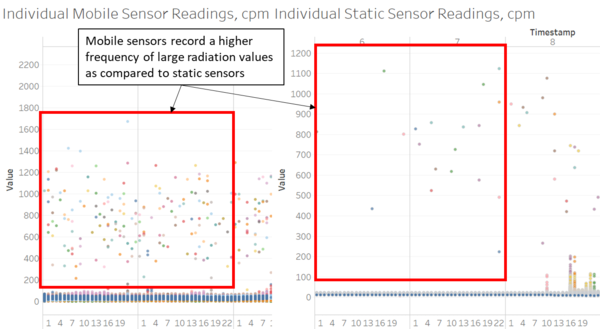
The static sensors can be said to have experienced less uncertainty than the mobile sensors. This can be observed from the number of high readings recorded on 6th April and 7th April, days where no significant event had occurred to increase the radiation levels in St. Himark. We would thus expect the radiation readings for these two days to be around the background radiation level, however the mobile sensor readings record many high radiation levels of up to 1700cpm in that period.
Uncertainty of the mobile sensors can also be said to be caused by the unpredictable movement of the sensors. Since they are placed on the citizens’ cars, the coverage of these mobile sensors is entirely dependent on the routes of the citizen. As such, this leaves some neighbourhoods without static or mobile sensor readings recorded during a time period, contributing to increased uncertainty when there are no cars passing that neighbourhood.
|
|
| A-3 |
Anomalies Detected:
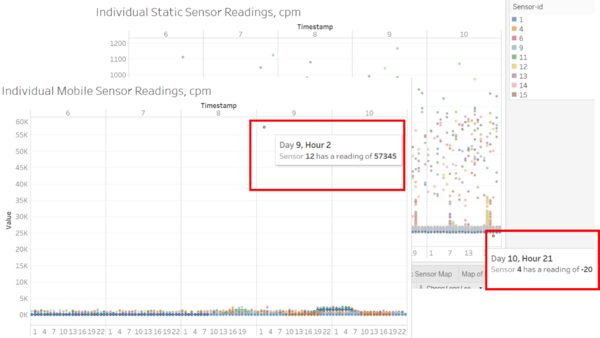
- For the static sensors, sensor-id 4 recorded a negative reading of -20 on 10th April, 2100. This is an anomaly as the radiation readings would not dip below 0, since background radiation is always present. Hence, we can conclude that this reading is due to a sensor malfunction.
- There was a large outlier in mobile sensor-id 12 of 57345 recorded on 9th April at 0200. We can hypothesise that the abnormal reading was due to a coolant leak from the power plant following the earthquake on St. Himark, given that the sensor was functioning normally before and after this point.
|
|
| A-4 |
To conclude the findings, static sensor 4 and 15 have higher uncertainty due to their abnormal readings and lack of readings, respectively.
As for the mobile sensors, those which record less than half of the maximum number of radiation readings for the mobile sensors can be said to be unreliable due to their lack of readings. The identified mobile sensors are 18, 48, 49, 6, 34.
Mobile sensors also generally suffer from higher uncertainty due to the lack of accuracy in measurements, probably since they are homemade and lower cost.
|
|
b. Compare uncertainty of the static sensors to the mobile sensors. What anomalies can you see? Are there sensors that are too uncertain to trust?
| S/N |
Findings |
Visual Proof
|
| B-1 |
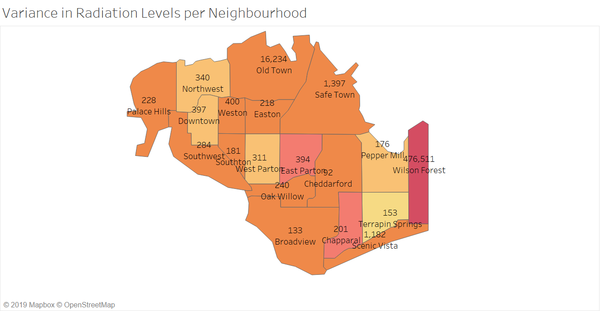
Based on the variance in radiation levels per neighbourhood over the entire simulation period found from the mobile sensor data, it was discovered that the top five neighbourhoods with the greatest variation radiation levels are as follows:
Wilson Forest, East Parton, Chapparal, Downtown, Northwest.
|
|
| B-2 |
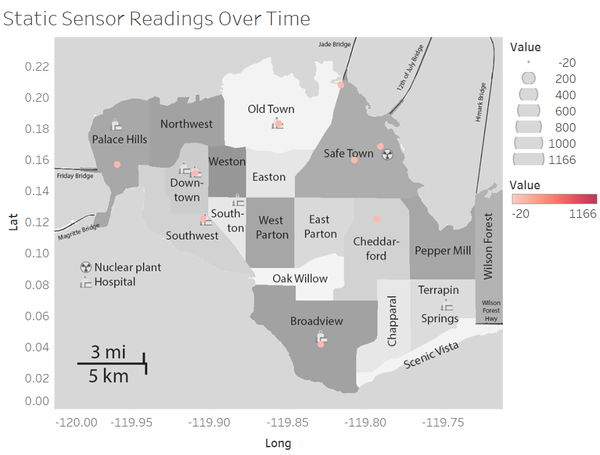
Based on the static sensor data, these regions are more prone to uncertainty. This is because there are no static sensors located in these regions. Given that static sensors have lower uncertainty in its measurements, the radiation readings taken from these regions are prone to higher uncertainty.
The neighbourhoods are:
Northwest, Weston, Southton, Easton, East Parton, West Parton, Oak Willow, Chapparal, Terrapin Springs, Pepper Mill, Wilson Forest.
|
|
c. What effects do you see in the sensor readings after the earthquake and other major events? What effect do these events have on uncertainty?
| S/N |
Findings |
Visual Proof
|
| C-1 |
The earthquake is likely to have occurred on the morning of 8th April. This is due to the following reasons:
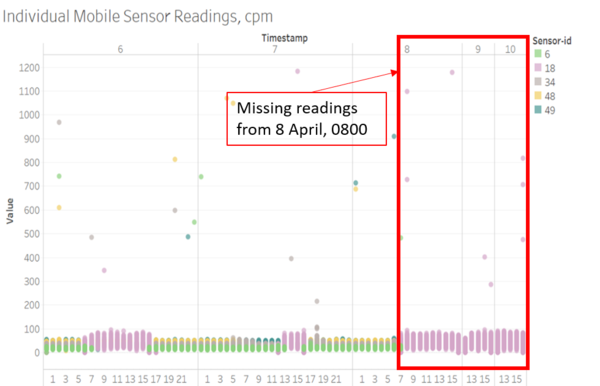
Looking closely at some of the mobile sensors which recorded readings lower than the average amount (18, 48, 6, 49, 34), many of them stopped reporting readings in the morning of 8th April. This could be due to damage done to the mobile sensors during the earthquake.
|
|
| C-2 |
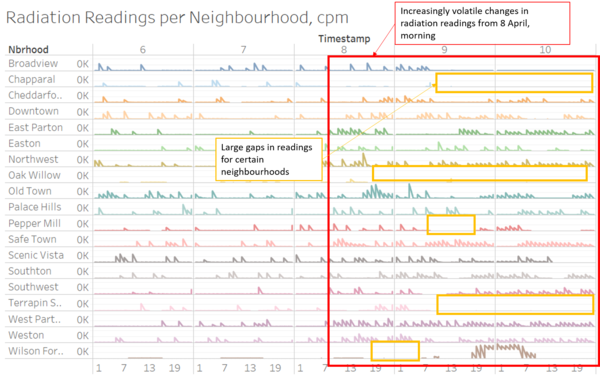
The average readings in each neighbourhood increased in the day following the earthquake, possibly due to the coolant leak from the nuclear plant which took time to spread to other neighbourhoods in St. Himark.
The lack of readings due to damage by the earthquake increases the uncertainty of the measurements as there are large gaps in the analysis for such sensors, leading us to make less accurate judgements of the state of radiation levels in the city.
As we can see, the radiation readings taken following the earthquake are much more volatile and have a larger variance. This is shown by the large spikes in radiation readings, which would be justified due to the coolant leak. However, these large spikes are followed by readings which do not vary that much from the background radiation level. This thus increases the uncertainty of the radiation readings.
|
|


